Daily Market Analysis By FXOpen
What's going on with the stock markets? It's all sudden panic!
Yesterday, it became clear that some of the world's most seasoned analysts and investment managers had begun to look at the US stock markets with trepidation.
Indeed, one particular long-established investment manager, Jeremy Grantham of GMO fame, stated on Monday that he envisages the S&P500 index to collapse by 26% by the end of the year, citing junk bonds and unstable NASDAQ tech stocks as possible reasons.
Well, today the nervousness is all out in the open and other very well recognized commentators are following suit.
Morgan Stanley stated during the late hours of the European evening yesterday that they expect the S&P500 to plunge by a further 17 to 17% in the next four months.
This is a sudden depiction of low confidence in company stocks listed on American exchanges, and it has sent waves through the entire global financial markets to the extent that everyone from bank executives to cryptocurrency HODLers are talking about a potential stock market crash.
Even in Australia, the ASX exchange, based in Sydney, experienced a total wipeout of over $72 billion in the value of its listed stocks yesterday, as commentator Scott Pape stated that the country is 'well overdue' for a major stock crash.
The last time a stock market collapse occurred at the same time as poor credit conditions was during the global banking crisis in 2008, and whilst there certainly are poor indicators this time, the 2008 financial crisis was purely bank related. The rest of the economy of the West was fully operational and could work to pull things back.
Now, however, Australia has been subjected to two years of draconian lockdowns, almost making it an isolated island. This impacted important trade with its key partners in the Asia Pacific region, all of which continued their business unhindered and became ever stronger.
The United States economy has been somewhat overlooked recently, largely because the US Dollar has been holding itself up well against other Western majors, all of which have been tanking, especially the British Pound, and although inflation is high in the United States, it is lower than it is in Europe and the United Kingdom.
Therefore, the weaknesses in corporate stock have been perhaps overlooked and now the doom-mongers are moving in.
the Australian Securities Exchange plunged by 2.75 per cent in the opening minutes this morning, wiping out $66billion, after another high inflation reading in the US sparked fears of a giant interest rate rise in the world's biggest economy.
As the winter draws closer, and the potential cost of domestic energy is on the minds of the American and European public, conservatism and looking to cover existing expenses rather than invest in new ones is a priority for many.
A bear market it certainly is.
VIEW FULL ANALYSIS VISIT - FXOpen Blog...
Disclaimer: CFDs are complex instruments and come with a high risk of losing your money.
ETHUSD and LTCUSD Technical Analysis – 15th SEP, 2022
ETHUSD: Hammer Pattern Above $1551
Ethereum was unable to sustain its bullish momentum and after touching a high of 1788 on 11th Sep the price started to decline against the US dollar. This decline was mainly attributed to the strength of the US dollar in the global markets and the subsequent increase in the market liquidity.
We can see a continued buying pressure since yesterday and the formation of a bullish price crossover pattern with moving averages MA20, MA50 and MA100 in the 15-minute time frame.
We can clearly see a hammer pattern above the $1551 handle which is a bullish pattern and signifies the end of a bearish phase and the start of a bullish phase in the markets.
ETH is now trading just above its pivot level of 1599 and moving in a strong bullish channel. The price of ETHUSD is now testing its classic resistance level of 1625 and Fibonacci resistance level of 1651 after which the path towards 1700 will get cleared.
The relative strength index is at 56 indicating a STRONGER demand for Ether and the continuation of the uptrend in the markets.
We can see that the super trend indicator is giving a bullish reversal signal in the 15-minute time frame.
We have also detected a bullish harami cross pattern in the 1 -hour time frame.
The STOCHRSI is indicating an OVERBOUGHT market, which means that the prices are expected to decline in the short-term range.
Most of the technical indicators are giving a STRONG BUY market signal.
Most of the moving averages are giving a BUY signal and we are now looking at the levels of $1750 to $1900 in the short-term range.
ETH is now trading below both the 100 & 200 hourly simple and exponential moving averages.
[*] Ether: bullish reversal seen above the $1551 mark
[*] Short-term range appears to be strongly BULLISH
[*] ETH continues to remain above the $1600 level
[*] The average true range is indicating HIGH market volatility
Ether: Bullish Reversal Seen Above $1551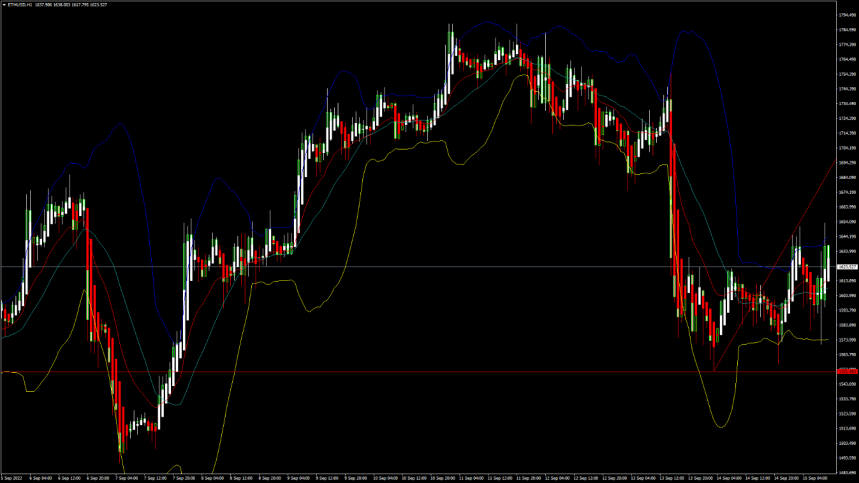
ETHUSD is now moving into a strongly bullish channel with the prices trading above the $1600 handle in the European trading session today.
ETH touched an intraday low of 1571 and an intraday high of 1651 in the European trading session today.
We have seen a bullish opening of the markets today indicating the underlying bullish nature of the markets.
We can see that MACD has crossed UP its moving average in the 4-hour time frame indicating the bullish tone, and now we are looking at the levels of 1800 to 2000 in the medium-term range.
The daily RSI is printing at 48 indicating a neutral demand in the long-term range.
The key support levels to watch are $1566 and $1501 and the prices of ETHUSD need to remain above these levels for the continuation of the bullish reversal in the markets.
ETH has increased by 1.40% with a price change of 22.33$ in the past 24hrs and has a trading volume of 24.474 billion USD.
We can see an increase of 5.50% in the total trading volume in the last 24 hrs which appears to be normal.
The Week Ahead
On the upside, the next visible targets are 1752 which is a 38.2% retracement from 4 week low, and 1690 which is a 50% retracement from 4 week high/low.
The prices of Ethereum are now testing its immediate resistance zone located at $1700 and we are likely to witness a rally in the prices once it touches these levels.
The immediate short-term outlook for Ether has turned strongly BULLISH, the medium-term outlook has turned NEUTRAL, and the long-term outlook for Ether is NEUTRAL in present market conditions.
The price of ETHUSD will need to remain above the important support level of $1500 this week.
The weekly outlook is projected at $1900 with a consolidation zone of $1700.
Technical Indicators:
The average directional change (14): is at 24.06 indicating a BUY
The moving averages convergence divergence (12,26): is at 0.48 indicating a BUY
The rate of price change: is at 2.61 indicating a BUY
The ultimate oscillator: is at 62.47 indicating a BUY
VIEW FULL ANALYSIS VISIT - FXOpen Blog...
Disclaimer: CFDs are complex instruments and come with a high risk of losing your money.
After a long period of hardship, the Japanese Yen is back on track
Japan's beleaguered economy has been kept relatively quiet on the global news scene over the past two years, but domestically, it has been at the forefront of everyone's minds for a long time now.
Japan's business-focused, ultra-conservative modus operandi was applauded by many during 2020 and 2021, as the country did not lock its population down and remained well and truly open for business at a time when many other nations did lock their population down.
Given that the country continues to demonstrate high quality industrial prowess in many manufacturing sectors, and that it has had a continuity of business at a time when other nations had theirs disrupted by their own governments, it would be an easy conclusion to draw that Japan is doing well.
Things are never quite that simple.
Japan has kept itself firmly out of the global political trends, and has focused on its own issues, another policy that would perhaps be very laudable under normal circumstances, however unfortunately the country's economy has been in dire straits for some time
During the course of this year until last week, the nation's currency, the Japanese Yen, had plunged in value by a remarkable 24% and competition from neighboring South East Asian nations in the field of electronics and precision engineering have been impacting the position of Japan as a top tier economy.
This week, however, there was a slight change in fortunes for the Japanese sovereign currency.
At the end of the US trading session yesterday, the Yen hit 144 against the US Dollar, which is a six-day high.
It also spiked against the British Pound, before relapsing to a low at the end of the British session.
Reuters conducted a poll which sought the opinion of 23 economists, 12 of which stated yesterday that their opinion is that the Japanese government would not buy up the yen in order to stop the currency from weakening further. However, 5 respondents did note that if USD/JPY were to hit 150, then it would prompt intervention by Japanese officials.
Perhaps the speculation that interest rates will likely not be increased gave the Yen a quick boost in confidence, given that increasing rates has been a major policy in the United States and Great Britain throughout 2022, with some pundits thinking that interest rates may rise to 7% by January in the United Kingdom from their current 1.75% rate.
The reality is that banks are looking to increase interest rates to around 5% for mortgages, which is still a jump from the existing rates available in the United Kingdom, and the Pound has taken a bashing over serious concerns that the economy is in big trouble.
It's a volatile period for the Yen, and this blip is a case in point.
VIEW FULL ANALYSIS VISIT - FXOpen Blog...
Disclaimer: CFDs are complex instruments and come with a high risk of losing your money.
ETHUSD and LTCUSD Technical Analysis – 22nd SEP, 2022
ETHUSD: Hammer Pattern Above $1220
Ethereum was unable to sustain its bullish momentum and after touching a high of 1393 on 21st Sep the prices started to decline against the US dollar. The prices of Ethereum touched a low of 1220 on 22nd Sep after which we can see a bounce upwards.
We can see a continued buying pressure today and we can see the formation of a bullish harami cross pattern in the 15-minutes time frame.
We can clearly see a hammer pattern above the $1220 handle which is a bullish pattern and signifies the end of a bearish phase and the start of a bullish phase in the markets.
ETH is now trading just above its pivot level of 1288 and is moving into a strong bullish channel. The price of ETHUSD is now testing its classic resistance level of 1298 and Fibonacci resistance level of 1308 after which the path towards 1400 will get cleared.
The relative strength index is at 47 indicating a NEUTRAL demand for Ether and a shift towards a consolidation phase in the markets.
We can see that the adaptive moving average AMA50 and MA50 both are giving a bullish trend reversal signal in the markets.
The STOCHRSI is indicating an OVERBOUGHT market, which means that the prices are expected to decline in the short-term range.
Most of the technical indicators are giving a STRONG BUY market signal.
Some of the moving averages are giving a BUY signal and we are now looking at the levels of $1400 to $1500 in the short-term range.
ETH is now trading below both the 100 & 200 hourly simple and exponential moving averages.
[*] Ether: bullish reversal seen above the $1220 mark
[*] Short-term range appears to be mildly BULLISH
[*] ETH continues to remain above the $1200 level
[*] The average true range is indicating LESS market volatility
Ether: Bullish Reversal Seen Above $1220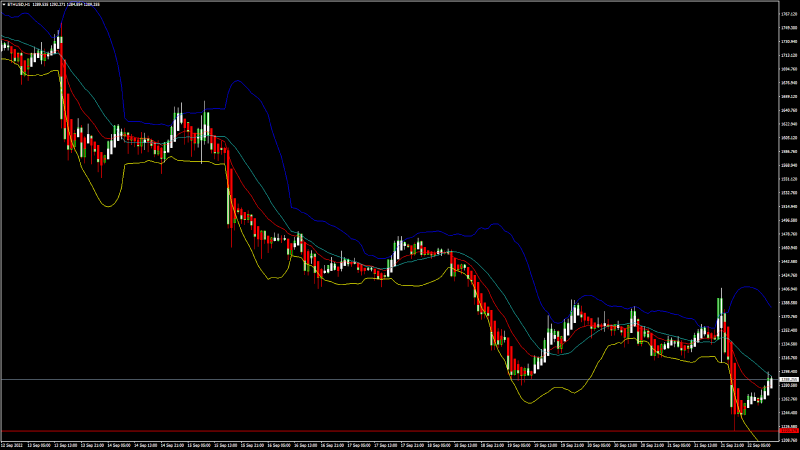
ETHUSD is now moving into a mildly bullish channel with the prices trading above the $1250 handle in the European trading session today.
ETH touched an intraday low of 1220 in the Asian trading session and an intraday high of 1297 in the European trading session today.
We have seen that the prices are near support of the channel indicating a bullish scenario.
The moving average MA100 is also indicating the bullish tone in the daily timeframe and now we are looking at the levels of 1500 to 1600 in the medium-term range.
The daily RSI is printing at 35 indicating a neutral demand in the long-term range.
The key support levels to watch are $1200 and $1258, and the prices of ETHUSD need to remain above these levels for the continuation of the bullish reversal in the markets.
ETH has decreased by 3.54% with a price change of 47.38$ in the past 24hrs and has a trading volume of 22.404 billion USD.
We can see an increase of 61.35% in the total trading volume in the last 24 hrs which is due to the heavy buying seen at lower levels by the medium-term investors.
The Week Ahead
The prices have been ranging into an oversold zone from last week and an upwards correction is expected. We are now looking for a sharp rally into the markets towards the $1600 levels.
The recent fall in the levels of Ethereum is attributed to the Federal Reserve which hiked the key interest rates for the third time this year.
The immediate short-term outlook for Ether has turned mildly BULLISH, the medium-term outlook has turned BULLISH, and the long-term outlook for Ether is NEUTRAL in present market conditions.
The prices of ETHUSD will need to remain above the important support level of $1200 this week.
The weekly outlook is projected at $1500 with a consolidation zone of $1400.
Technical Indicators:
The average directional change (14): is at 16.88 indicating a NEUTRAL level
The Williams percent range: is at -36.05 indicating a BUY
The bull/bear power (13): is at 12.62 indicating a BUY
The ultimate oscillator: is at 52.57 indicating a BUY
VIEW FULL ANALYSIS VISIT - FXOpen Blog...
Disclaimer: CFDs are complex instruments and come with a high risk of losing your money.
AUD/USD and NZD/USD Face Key Hurdles, Downtrend Intact
AUD/USD is facing a strong resistance near the 0.6660 zone. NZD/USD is also struggling to clear the 0.5900 resistance zone.
Important Takeaways for AUD/USD and NZD/USD
[*] The Aussie Dollar started a fresh decline from well above the 0.6700 zone against the US Dollar.
[*] There is a key bearish trend line forming with resistance near 0.6650 on the hourly chart of AUD/USD.
[*] NZD/USD started an upside correction from the 0.5800 support zone.
[*] There is a connecting bearish trend line forming with resistance near 0.5850 on the hourly chart of NZD/USD.
AUD/USD Technical Analysis
The Aussie Dollar failed to stay above the 0.6700 level and started a fresh decline against the US Dollar. The AUD/USD pair traded below the 0.6650 support zone to move into a bearish zone.
There was a clear move below the 0.6620 level and the 50 hourly simple moving average. The pair traded as low as 0.6575 on FXOpen and recently started an upside correction. There was a move above the 0.6620 level.
AUD/USD Hourly Chart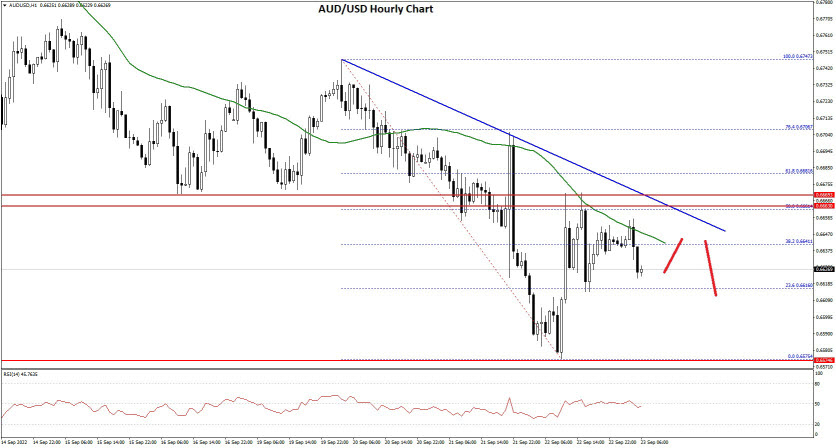
The bulls pushed the pair above the 38.2% Fib retracement level of the downward move from the 0.6747 swing high to 0.6575 swing low.
However, the bears remained active near the 0.6660 zone and the 50 hourly simple moving average. The pair failed to clear the 50% Fib retracement level of the downward move from the 0.6747 swing high to 0.6575 swing low.
There is also a key bearish trend line forming with resistance near 0.6650 on the hourly chart of AUD/USD. On the upside, the AUD/USD pair is facing resistance near the 0.6650 level.
The next major resistance is near the 0.6660 level. A close above the 0.6660 level could start a steady increase in the near term. The next major resistance could be 0.6720.
On the downside, an initial support is near the 0.6600 level. The next support could be the 0.6560 level. If there is a downside break below the 0.6560 support, the pair could extend its decline towards the 0.6500 level.
VIEW FULL ANALYSIS VISIT - FXOpen Blog...
Disclaimer: CFDs are complex instruments and come with a high risk of losing your money.
Watch FXOpen's September 19 - 23 Weekly Digest Video
In this video, FXOpen UK COO Gary Thomson sums up the week’s happenings and discusses the most significant news reports.
[*] The British pound hits 37-year low against US dollar
[*] How mobilization in Russia will affect financial markets
[*] US stock market complacency on the bankers' radar
[*] After a long period of hardship, the Japanese yen is back on track
Watch our short and informative video, and stay updated with FXOpen.
VIEW FULL NEWS VISIT - FXOpen Company News...
Disclaimer: CFDs are complex instruments and come with a high risk of losing your money.
Slight opening gain as FTSE 100 wakes up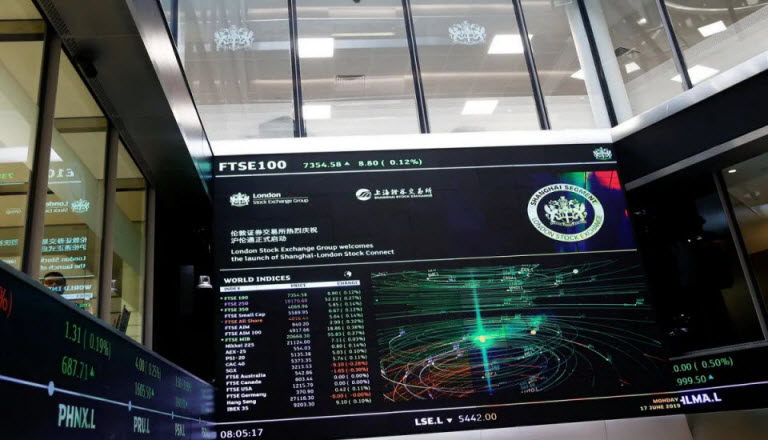
The doom and gloom that has surrounded the British Pound's seemingly endless fall from glory to almost parity with the US Dollar in its lowest point in recorded history has been a major consideration for traders across the world.
A clear indicator of the dire straits that the British economy finds itself in after many years of policy which has blown the coffers to an extent that there are serious concerns about how many people will manage to get through the winter, the Pound still languishes, but the FTSE 100 index has begun to increase just a few ticks this morning.
As the opening bell sounded in London this morning, analysts and traders began their day with a degree of optimism, expecting the London Stock Exchange's index containing its 100 most prestigious publicly listed companies to begin the day a few points higher than yesterday.
This mood was created by the Pound's slight slowdown in its apparent freefall, and news from the British government that the Treasury will hold a full Budget in the spring of 2023 and the Bank of England confirmed that it is keeping watch on markets and would not hesitate to raise rates.
The impending rate rises are a cause for concern, however, as a potential increase from the current rate of around 2.25% to over 5% by January is being speculated upon, and if that happens, it could well cause a serious issue for borrowers and plunge the economy into a recession.
In line with expectations, The FTSE 100 rose over 27 points in the opening session this morning in London, arriving at 7048.65, a gain of 0.4%. It extended a marginal overall rise notched up by the end of the previous session partially as a result of the news from the UK treasury.
Caution is still abound, however, especially as some mortgage lenders have removed some of the deals available in anticipation of increasing interest rates, giving rise to a possible notion that they are afraid of possible defaults should the rates go to over 5% as is being mooted by some analysts and investment banks.
This morning's upward movers on the FTSE 100 index were mainly some of the raw materials and resource stocks. Anglo American was up 50p to 2647p and Rio Tinto gained 69p to 4767p.
Given the anticipation that interest rates will rise to much higher levels than current ones, it is perhaps to be expected that the fallers on the FTSE 100 index today are house building companies. Persimmon stock dropped by 6p per share to 1258p, and Barratt stock fell 2.2p to 383p,
Rightmove, which is an online portal for real estate agencies to list their properties for rent or sale, saw its stock fall 4.4p to 545p per share.
In congruence with this, some of the major retail banks, NatWest and Lloyds notably, experienced falling share prices.
It's been a raw materials dominated world this year, and today's figures are no different.
VIEW FULL ANALYSIS VISIT - FXOpen Blog...
Disclaimer: CFDs are complex instruments and come with a high risk of losing your money.
BTCUSD and XRPUSD Technical Analysis – 27th SEP 2022
BTCUSD: Double Bottom Pattern Above $18566
Bitcoin was unable to sustain its bearish momentum and after touching a low of 18279 on 21st Sep, the price has continued to escalate upwards and crossed the $20000 handle today in the European trading session.
This upside break was long overdue and now marks the beginning of rebound towards the $25000 level.
We can see the formation of bullish engulfing lines in the 15-minute and weekly time frames.
The momentum indicator is back over zero indicating a bullish scenario in both the 30-minute and daily time frames.
We can clearly see a double bottom pattern above the $18566 handle which is a bullish reversal pattern because it signifies the end of a downtrend and a shift towards an uptrend.
Bitcoin touched an intraday low of 19097 in the Asian trading session and an intraday high of 20310 in the European trading session today.
Both the STOCH and STOCHRSI are indicating overbought levels which means that in the immediate short term, a decline in the prices is expected.
The relative strength index is at 75 indicating an OVERBOUGHT market, and the possibility of some downwards correction due to profit taking by the medium-term investors.
Bitcoin is now moving above its 100 hourly simple moving average and below its 200 hourly exponential moving averages.
Most of the major technical indicators are giving a STRONG BUY signal, which means that in the immediate short term, we are expecting targets of 22000 and 23500.
The average true range is indicating LESS market volatility with a strong bullish momentum.
[*] Bitcoin: bullish reversal seen above $18566.
[*] The Williams percent range is indicating an overbought level.
[*] The price is now trading just above its pivot level of $20179.
[*] All of the moving averages are giving a STRONG BUY market signal.
Bitcoin: Bullish Reversal Seen Above $18566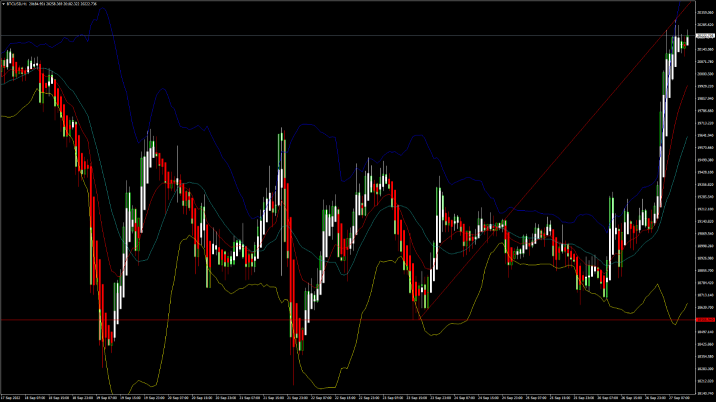
The price of bitcoin continues to rise amid the buying pressure and improved investor sentiments. We are now looking at the important target levels of $22000 and $25000 in the medium-term ranges.
The adaptive moving averages AMA20 and AMA50 are both giving a bullish trend reversal signal in the 15-minute and daily timeframes.
We can see the formation of a bullish harami pattern in the 2-hour time frame.
We have also detected a bullish opening of the markets indicating the underlying bullish sentiment.
The immediate short-term outlook for bitcoin is bullish, the medium-term outlook has turned bullish, and the long-term outlook remains neutral under present market conditions.
Bitcoin’s support zone is located at $19000, and the price continues to remain above these levels for the continuation of the bullish reversal in the markets.
The price of BTCUSD is now facing its classic resistance level of 20253 and Fibonacci resistance level of 20298 after which the path towards 22000 will get cleared.
In the last 24hrs, BTCUSD has increased by 5.87% by 1120$ and has a 24hr trading volume of USD 48.845 billion. We can see an increase of 46.08% in the trading volume compared to yesterday, due to global buying pressure by the long-term investors.
The Week Ahead
The price of bitcoin is moving in a consolidation zone above the $20000 level. Further upsides are projected at $21000 and $22500 as the immediate targets.
The price of bitcoin reached its peak value of $69000 last year the month of November, and at the present level of $20000, we still need to recover ground towards the $40000 level, which if reached will mark a gain of 100% from the present market level.
The history of bitcoin price action shows that it is capable of doing so, and has done in the past.
The daily RSI is printing at 52 which indicates a neutral level and a move towards the consolidation phase in the markets.
The prices of BTCUSD will need to remain above the important support level of $19000 this week.
The weekly outlook is projected at $22000 with a consolidation zone of $21500.
Technical Indicators:
The moving averages convergence divergence (12,26): is at 323.90 indicating a BUY
The ultimate oscillator: is at 62.28 indicating a BUY
The rate of price change: is at 5.93 indicating a BUY
The average directional change (14): is at 51.06 indicating a BUY
VIEW FULL ANALYSIS VISIT - FXOpen Blog...
Disclaimer: CFDs are complex instruments and come with a high risk of losing your money.
Big British banks pull mortgages: Pound tanks further while dollar soars
Perhaps the greatest anomaly of this year remains why the US Dollar has held such a strong value against other major currencies given that the United States economy has been subjected to similar obstacles that have affected its peers in Great Britain and on the European Mainland.
As this week began, the British Pound collapsed in value to a record low against the US dollar as investors rushed to sell the currency and government bonds in a demonstration of skepticism over new Prime Minister Liz Truss’s economic plans, however since then further displays of low confidence have surfaced.
Yesterday, 10 major retail banks in the United Kingdom removed a plethora of mortgage products from the market, and considerably reworked the terms available on some of the mortgage products which remain on the market, in order to manage potential risk if interest rates rise to the expected 5 to 6% by January.
Should such a level of interest rates be reached, this would increase payments on personal and commercial debt substantially, as currently the interest rate is around 2.6%.
This, combined with a tanking Pound, and inflation heading for 18% by January according to Citigroup analysts last month, is a combination of equations which do not make for a healthy borrowing environment.
By removing these mortgage products, the property market outside London has begun to be affected, and consumer activity including house purchasing is likely to be curtailed, which would slow down the economy even further.
The FTSE 100 responded to this accordingly yesterday, with house building company stock losing value whilst raw materials providers and mineral extraction giants rose in value.
It certainly appears that the commodities and materials sector is buoyant due to high demand, but anything requiring borrowing in order to purchase the final product is now sinking in value.
The Pound is now almost at parity with the US Dollar, as demonstrated earlier today during the Asian trading session when the British Pound reached a low point of $1.0327 against the US Dollar, surpassing the previous record low reached in 1985, before making back some of its value.
Precarious is an understatement. With banks mitigating risk on such a massive scale, it looks like the roller coaster ride is not yet over.
VIEW FULL ANALYSIS VISIT - FXOpen Blog...
Disclaimer: CFDs are complex instruments and come with a high risk of losing your money.
Gold Price and Crude Oil Price Could Gain Bullish Momentum
Gold price started a recovery wave from the $1,615 level. Crude oil price could gain bullish momentum if it clears the $82.50 resistance zone.
Important Takeaways for Gold and Oil
[*] Gold price found support near $1,615 and started a recovery wave against the US Dollar.
[*] There was a break above a key bearish trend line with resistance near $1,658 on the hourly chart of gold.
[*] Crude oil price also started a recovery wave from the $76.00 zone.
[*] There is a major bearish trend line forming with resistance near $81.75 on the hourly chart of XTI/USD.
Gold Price Technical Analysis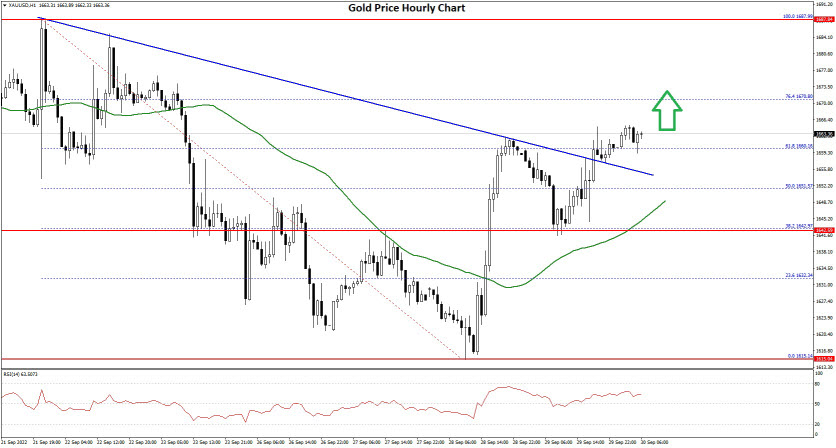
Gold price declined heavily below the $1,700 level against the US Dollar. The price gained bearish momentum and declined below the $1,680 level.
There was a clear move below the $1,650 support zone and the 50 hourly simple moving average. The price traded as low as $1,615 and recently there was a recovery wave. The price was able to clear the $1,625 resistance zone.
There was a move above the 50% Fib retracement level of the downward move from the $1,687 swing high to $1,615 low. There was also a break above a key bearish trend line with resistance near $1,658 on the hourly chart of gold.
The price of XAU/USD is now trading above the 61.8% Fib retracement level of the downward move from the $1,687 swing high to $1,615 low.
On the upside, the price is facing resistance near the $1,670 level. The first major resistance is near the $1,680 level. The main resistance is now forming near the $1,688 level, above which it could even test $1,700.
A clear upside break above the $1,700 resistance could send the price towards $1,720. An immediate support on the downside is near the $1,655 level. The next major support is near the $1,650 level, below which there is a risk of a larger decline. In the stated case, the price could decline sharply towards the $1,620 support zone.
VIEW FULL ANALYSIS VISIT - FXOpen Blog...
Disclaimer: CFDs are complex instruments and come with a high risk of losing your money.