Daily Market Analysis By FXOpen
GBP/USD Faces Hurdles, EUR/GBP Could Correct Losses
GBP/USD started a fresh decline from the 1.2165 resistance. EUR/GBP declined heavily and tested the 0.8440 support zone.
Important Takeaways for GBP/USD and EUR/GBP
The British Pound started a fresh decline from the 1.2165 zone against the US Dollar.
There is a key bullish trend line forming with support near 1.1960 on the hourly chart of GBP/USD.
EUR/GBP declined below the 0.8550 and 0.8500 support levels.
There is a major bearish trend line forming with resistance near 0.8480 on the hourly chart.
GBP/USD Technical Analysis
The British Pound failed to gain strength above the 1.2200 level against the US Dollar. The GBP/USD pair started a fresh decline below the 1.2150 and 1.2120 support levels.
There was a clear move below the 1.2000 support level and the 50 hourly simple moving average. The bears even pushed the pair below the 1.1950 level. A low was formed near 1.1875 on FXOpen the pair is now correcting losses.
GBP/USD Hourly Chart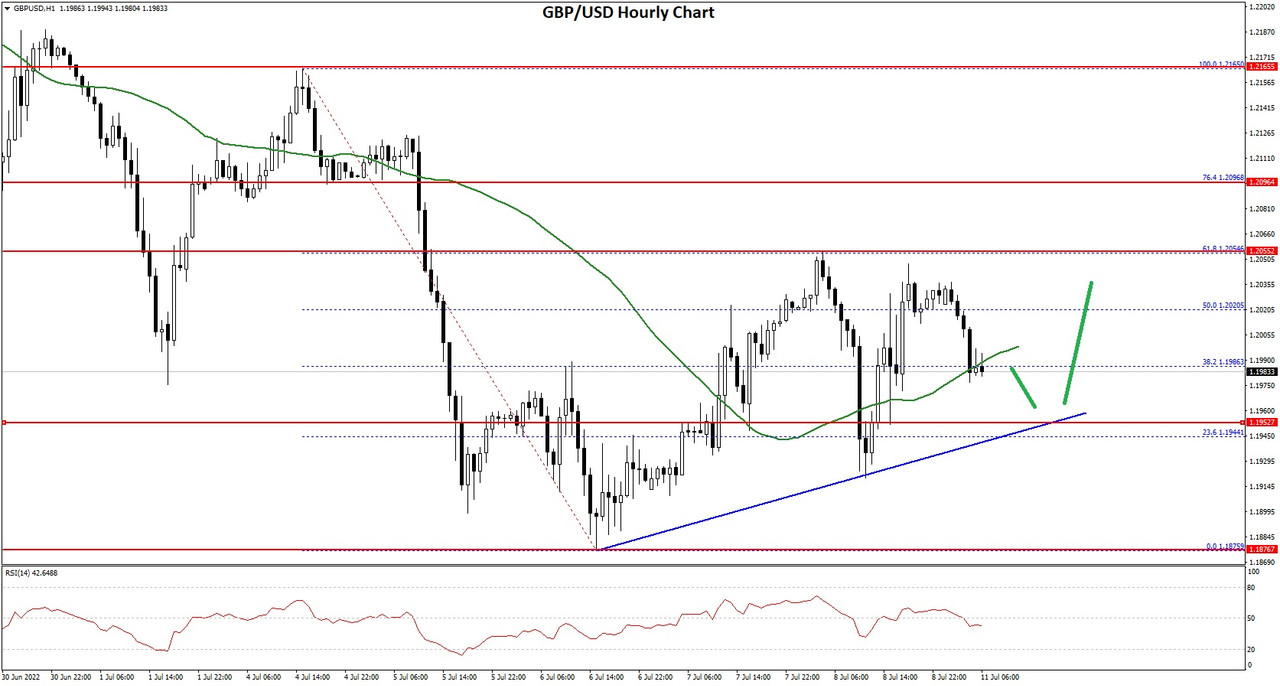
There was a move above the 1.1950 and 1.2000 resistance levels. The pair even climbed above the 50% Fib retracement level of the downward move from the 1.2165 swing high to 1.1875 low.
However, the pair faced sellers near the 1.2050 level. It struggled near the 61.8% Fib retracement level of the downward move from the 1.2165 swing high to 1.1875 low. On the upside, an initial resistance is near the 1.2020 level.
The next main resistance is near the 1.2050 zone. A clear upside break above the 1.2020 and 1.2050 resistance levels could open the doors for a steady increase in the near term. The next major resistance sits near the 1.2165 level.
If not, the pair might start a fresh decline below 1.1980. There is also a key bullish trend line forming with support near 1.1960 on the hourly chart of GBP/USD. The next major support is near the 1.1920 level. Any more losses could lead the pair towards the 1.1875 support zone or even 1.1800.
Read Full on FXOpen Company Blog...
BTCUSD and XRPUSD Technical Analysis – 12th JULY 2022
BTCUSD: Double Top Pattern Below $22015
Bitcoin was unable to sustain its bullish momentum last week, and after touching a high of 22181 on 8th July, started to decline against the US dollar. The downfall of bitcoin continues today and is now trading below the $20000 handle in the European trading session.
The price of bitcoin failed to clear its resistance zone of $23000, and we can see that price is struggling to keep itself above the important psychological support level of $20000.
We can clearly see a double top pattern below the $22015 handle which is a bearish reversal pattern because it signifies the end of an uptrend and a shift towards a downtrend.
Bitcoin touched an intraday high of 20419 in the Asian trading session and an intraday low of 19570 in the European trading session today.
Both the STOCH and Williams percent range are indicating overbought levels which means that in the immediate short term, a decline in the prices is expected.
The relative strength index is at 29 indicating a weak demand for bitcoin at the current market level.
Bitcoin is now moving below its 100 hourly simple moving average and its 200 hourly simple moving average.
All of the major technical indicators are giving a strong sell signal, which means that in the immediate short term, we are expecting targets of 19500 and 19000.
The average true range is indicating lesser market volatility with a bearish momentum.
[*] Bitcoin: a bearish reversal seen below $22015
[*] The Williams percent range is Indicating an OVERBOUGHT level
[*] The price is now trading just below its pivot level of $19729
[*] All of the MAs are giving a STRONG SELL market signal
Bitcoin: Bearish Reversal Seen Below $22015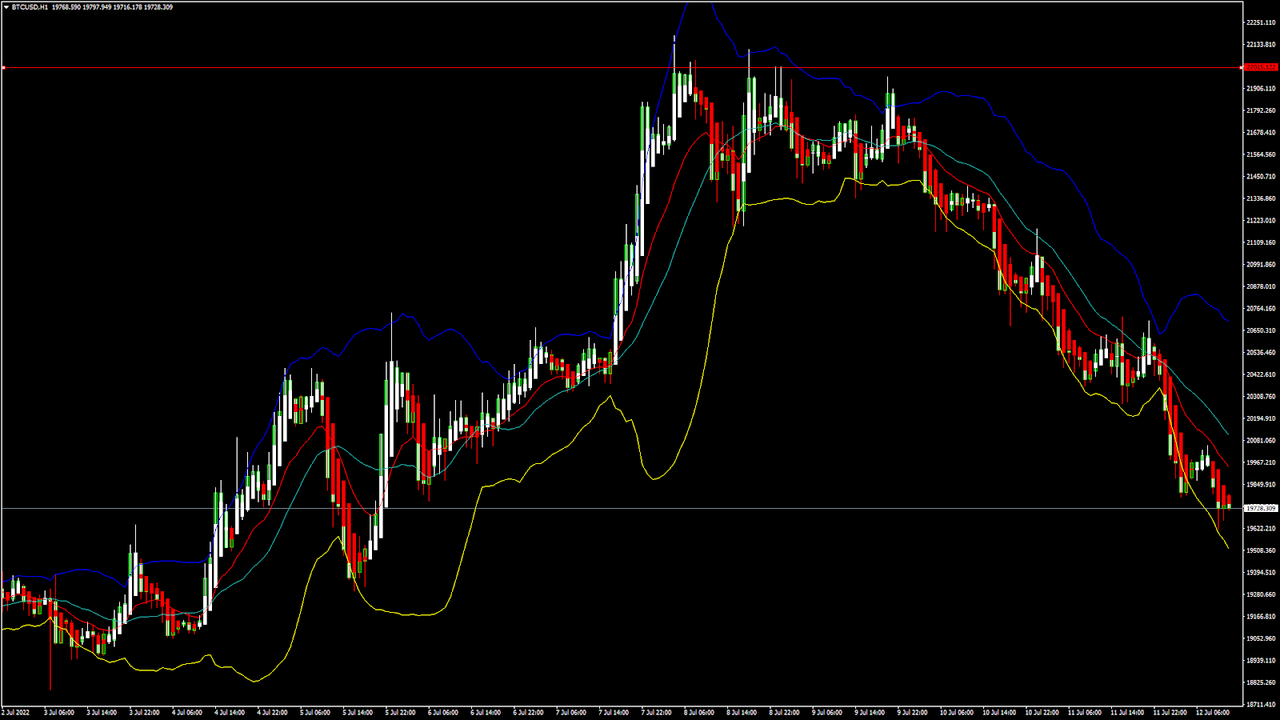
The prices of bitcoin continue to decline below the $20000 handle, and we are now testing the important support level of $19000 in the European trading session.
The global sentiments are weak, and the strength of the US dollar is causing bitcoin to lose its value in the short term.
We can see the formation of a falling trend channel, and now we are facing the immediate targets of $19500 and $19000.
Bitcoin continues to remain under short-term bearish pressure, and the prices are expected to enter into a consolidation channel above the $19000 handle.
The immediate short term outlook for bitcoin is bearish, the medium term outlook has turned neutral; and the long-term outlook remains neutral under present market conditions.
The Bitcoin support zone is located at $18607, and the price continues to remain above these levels during the bearish phase of the markets.
The price of BTCUSD is now facing its classic support levels of 19373 and Fibonacci support level of 19639 after which the path towards 19000 will get cleared.
In the last 24hrs BTCUSD has increased by 4.12% by 845$ and has a 24hr trading volume of USD 26.023 billion. We can see a decrease of 5.08% in the trading volume as compared to yesterday, which appears to be normal.
The Week Ahead
The prices of bitcoin are moving in a bearish momentum, and the immediate targets are $19500 and $18500.
The daily RSI is printing at 35 which means that the medium range demand continues to be weak.
We can see the formation of a contraction triangle below the $21752 and further downside breaks are expected this week.
The price of BTCUSD will need to remain above the important support level of $18000 this week.
The weekly outlook is projected at $18500 with a consolidation zone of $18000.
Technical Indicators:
The average directional change (14 days): at 38.07 indicating a SELL
The ultimate oscillator: at 38.89 indicating a SELL
The rate of price change: at -4.36 indicating a SELL
The commodity channel index (14 days): at -140 indicating a SELL
Read Full on FXOpen Company Blog...
Big tech earnings awaited; the strong US Dollar could be their achilles heel
The Big Tech stocks which are listed on prominent North American stock exchanges have been unusually volatile recently.
Large technology companies such as Microsoft, Apple and Google are often regarded by traders as steady, non-volatile investments which only move very slightly, hence their wide-ranging popularity among all kinds of traders and investors.
Recently, however, things have been somewhat different. There was a considerable collapse in the value of the stock of many big tech companies recently, which even as recently as May this year was being described by the mainstream media as 'far from over'.
Such volatility is rare, however now there is another element which is important to consider; the strong US Dollar.
The US Dollar has been surprisingly strong against its rival major currencies recently, and this strength is looking likely to affect the performance of the stocks of American big tech firms with a global audience such as Apple, Meta (Facebook), Alphabet (Google), Netflix and Tesla as their largest percentage of sales and revenue is generated outside the United States.
Therefore, being US-headquartered companies, the strong dollar vs weaker currencies in the regions in which these companies conduct most of their business means that there is a potential impact on revenues looming.
Asian currencies have fallen much less than the euro, and hedging and shifting production can cut currency volatility. This may seem an extreme logistics and organizational exercise, but it is possible given the global footprint of these multinational giants and the need to hedge against the currency market's considerable movements between US Dollar and other currencies lately.
To demonstrate how this actually works, it is worth looking at the 11% increase this year against a basket of currencies that the US Dollar has achieved, and especially the 12% it has gained against the euro.
This could potentially create a major issue as earnings season begins. For example, many companies included in the S&P500 index generate 29% of their sales from outside the United States according to Goldman Sachs.
These companies often sell those products or services in local currencies, then report financial results including those sales in dollars. Therefore, if Nike sells a pair of shoes for 100 euros, it was worth about $7 less at the end of its quarter than at the beginning of the same quarter.
Given the economic woes that exist in the United States such as spiraling inflation which is at its highest point in 40 years, and a cost of living crisis, it may be difficult to understand why the US Dollar is rising against other majors such as the Euro and British Pound, both of which are legal tender in regions that face the exact same economic woes as the United States. Mainland Europe and Britain are both mired in high inflation and cost of living crises, but the Dollar is trumping the Euro and Pound.
One possible explanation for this could be that the dollar has risen for the reason it often does during global economic weakness, in that it is viewed as the world’s reserve currency, and therefore a safe haven.
Perhaps Bitcoin had been viewed that way as it is decentralized and away from the politicians and central banks, but the US Dollar is even performing well against Bitcoin and has been for a number of weeks now.
This matter in which the US Dollar's strength may impact corporate earnings is interesting, therefore the big publicly listed stocks are equally interesting to watch as the earnings reports are released.
FXOpen Blog
EUR/USD Dives To Parity, USD/JPY Eyes More Upsides
EUR/USD extended decline and tested the 1.0000 support. USD/JPY is rising and might continue to gain pace towards the 140.00 resistance
Important Takeaways for EUR/USD and USD/JPY
[*] The Euro started a fresh decline and even tested the 1.0000 support.
[*] There is a major bearish trend line forming with resistance near 1.0035 on the hourly chart of EUR/USD.
[*] USD/JPY gained pace after it broke the 136.00 resistance zone.
[*] There is a key rising channel forming with support near 135.70 on the hourly chart.
EUR/USD Technical Analysis
This past week, the Euro started a major decline from well above the 1.0500 level against the US Dollar. The EUR/USD pair declined below the 1.0320 and 1.0250 support levels.
The bears even pushed the pair below the 1.0100 level. There was a close below 1.0100 and the 50 hourly simple moving average. It tested the parity zone and a low is formed near 1.0000 on FXOpen.
EUR/USD Hourly Chart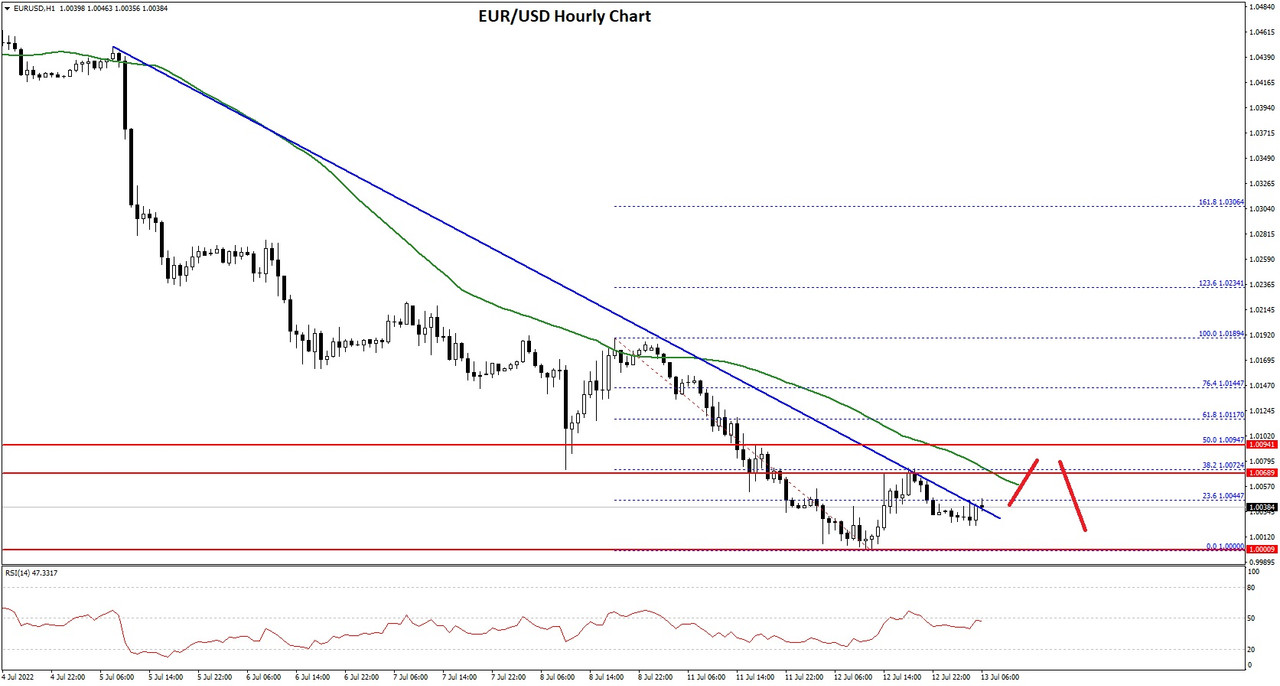
It is now consolidating losses and trading above the 1.0020 level. An immediate resistance on the upside is near the 1.0035 level. There is also a major bearish trend line forming with resistance near 1.0035 on the hourly chart of EUR/USD.
The trend line is near the 23.6% Fib retracement level of the downward move from the 1.0189 swing high to 1.0000 low. The next major resistance is near the 1.0070 level and the 50 hourly simple moving average.
The main resistance is near the 1.0100 level. It is near the 50% Fib retracement level of the downward move from the 1.0189 swing high to 1.0000 low. An upside break above 1.0100 could set the pace for a steady increase.
If not, the pair might drop and test the 1.0000 support. The next major support is near 0.9950, below which the pair could drop to 0.9900 in the near term.
Read Full on FXOpen Company Blog...
ETHUSD and LTCUSD Technical Analysis – 14th JULY, 2022
ETHUSD: Ascending Triangle Pattern Above $1006
Ethereum was unable to sustain its bullish momentum, and after touching a high of 1251 on 9th July started to decline against the US dollar touching a low of 1006 on 13th July.
After this steep decline, we can see that the prices have recovered and started upwards correction with a bullish momentum.
We can see that ETH is gaining traction against the US dollar as the price remains supported above the $1050 handle in the European trading session today.
The prices touched an intraday low of $1075 and an intraday high of $1125 in the Asian trading session today.
We can clearly see an ascending triangle pattern above the $1006 handle which is a bullish pattern and signifies the end of a bearish phase and the start of a bullish phase in the markets.
ETH is now trading below its pivot levels of 1101 and is moving into a mildly bullish channel. The price of ETHUSD is now testing its classic resistance level of 1107 and Fibonacci resistance level of 1112 after which the path towards 1200 will get cleared.
The relative strength index is at 54 indicating a NEUTRAL market and the continuation of the uptrend in the markets.
The Williams percent range and commodity channel index are indicating NEUTRAL levels, which means that the prices are expected to enter into a consolidation phase in the short-term range.
Some of the technical indicators are giving a BUY market signal. Some of the moving averages are giving a BUY signal, and we are now looking at the levels of $1100 to $1150 in the short-term range.
ETH is now trading below both its 100 hourly simple and exponential moving averages.
[*] Ether: bullish continuation seen above the $1006 mark
[*] Short-term range appears to be mildly BULLISH
[*] ETH continues to remain above the $1000 level
[*] The average true range is indicating LESS market volatility
Ether: Bullish Continuation Seen Above $1006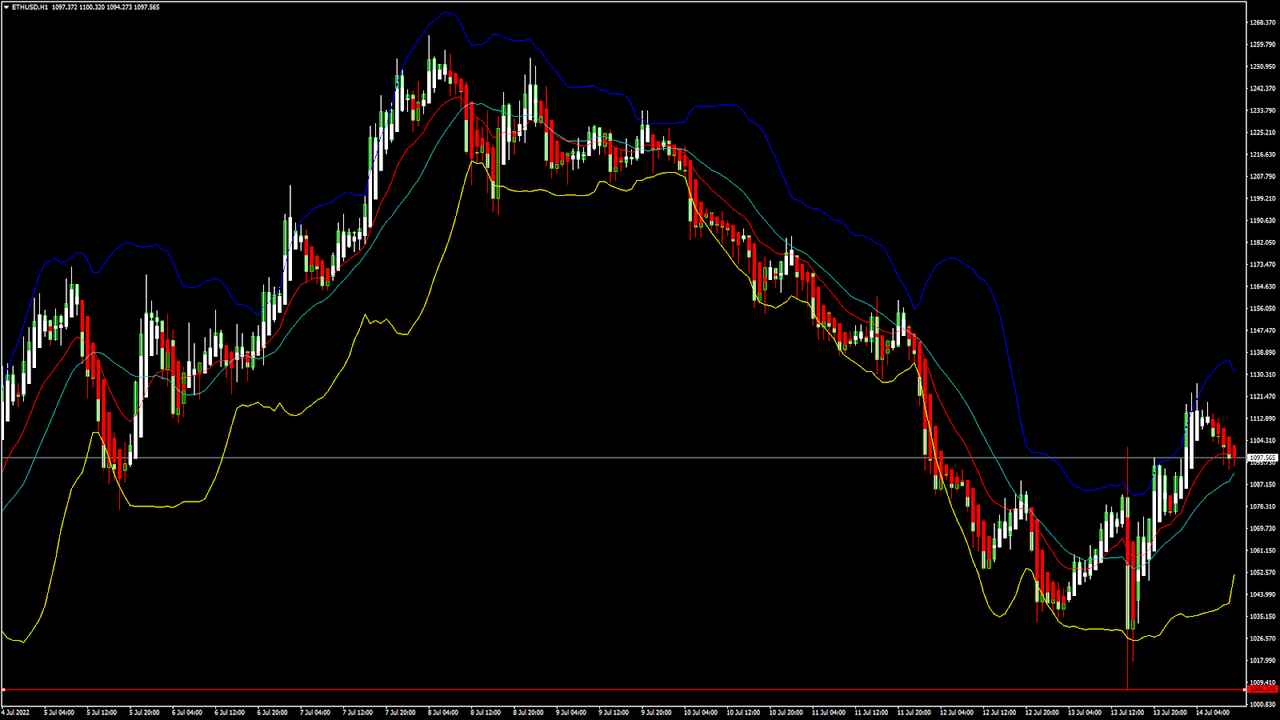
ETHUSD is now moving in a mildly bullish channel with the prices trading above the $1050 handle in the European trading session today.
We have also detected the formation of MA20 and MA50 crossover patterns in the hourly time frame indicating that the price is likely to climb higher crossing the $1150 level.
We can see that the prices of Ethereum are slowly preparing for the next move above the $1100 level today.
The STOCHRSI is indicating an oversold market, which means that the prices are due to correct upwards in the short-term range.
The current price action is positive for the markets, and the prices are expected to remain above the $1000 level in the US trading session today.
The key support levels to watch are $1085 and $1093, and the prices of ETHUSD need to remain above these levels for the continuation of the bullish trend.
ETH has increased by 2.90% with a price change of 30$ in the past 24hrs and has a trading volume of 18.112 billion USD.
We can see an increase of 39.80% in the total trading volume in the last 24 hrs which is due to buying seen at lower levels by the medium-term investors.
The Week Ahead
On an upside potential $1300 remains as a major hurdle, and the price of Ethereum will test this resistance zone next week.
The price of Ethereum continues to remain above the important psychological support level of $1000 and some of the technicals are now indicating a bullish market.
The immediate short-term outlook for Ether has turned mildly BULLISH; the medium-term outlook has turned NEUTRAL; and the long-term outlook for Ether is NEUTRAL in present market conditions.
This week, Ether is expected to move in a range between $1000 and $1150, and next week, it is expected to enter into a consolidation phase above $1150.
Technical Indicators:
The STOCH (9,6): at 57.54 indicating a BUY
The moving averages convergence divergence (12,26): at 10.20 indicating a BUY
The rate of price change: at 0.321 indicating a BUY
Bull/Bear power (13): at 1.08 indicating a BUY
Read Full on FXOpen Company Blog...
AUD/USD and NZD/USD Eye Key Upside Break
AUD/USD is attempting a recovery wave above the 0.6750 resistance. NZD/USD is also eyeing a key upside break above the 0.6140 resistance.
Important Takeaways for AUD/USD and NZD/USD
[*] The Aussie Dollar started a fresh decline below the 0.6800 support zone against the US Dollar.
[*] There is a key bearish trend line forming with resistance near 0.6750 on the hourly chart of AUD/USD.
[*] NZD/USD also started a major decline from the 0.6200 resistance zone.
[*] There is a major bearish trend line forming with resistance near 0.6135 on the hourly chart of NZD/USD.
AUD/USD Technical Analysis
The Aussie Dollar attempted a fresh increase above the 0.6800 and 0.6810 levels against the US Dollar. However, the AUD/USD pair failed to continue higher above 0.6800 and started another decline.
There was a move below the 0.6750 and 0.6720 support levels. There was a close below the 0.6750 level and the 50 hourly simple moving average. The pair traded as low as 0.6681 and is currently correcting losses.
AUD/USD Hourly Chart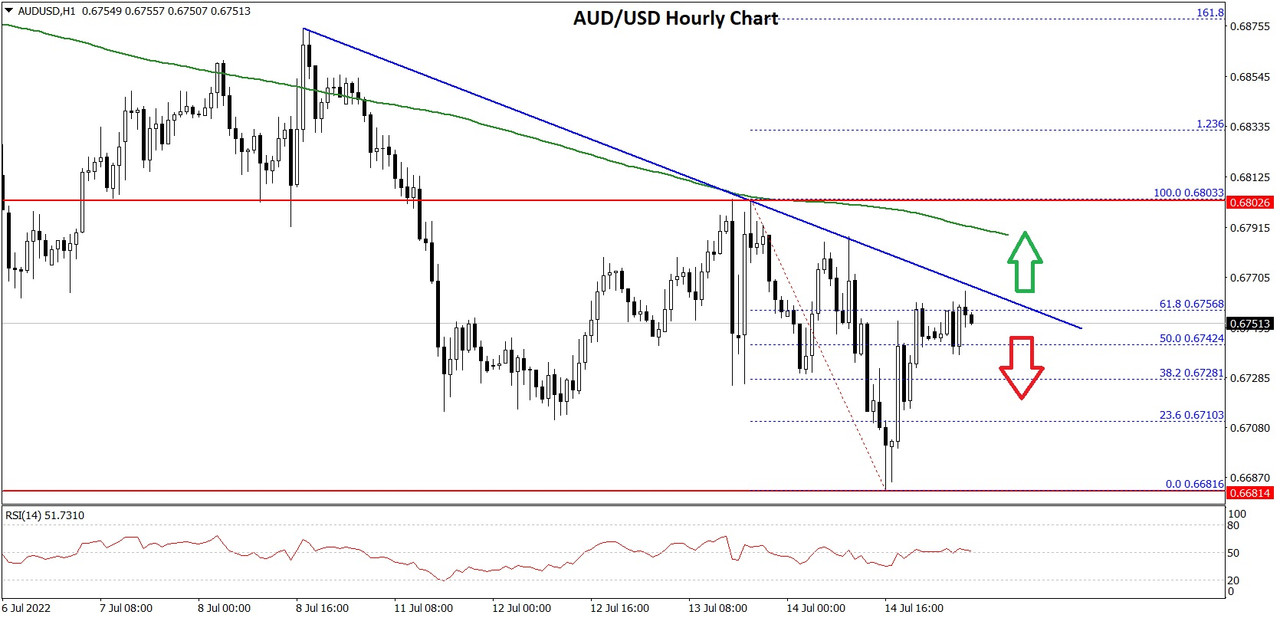
There was a move above the 0.6725 resistance level. The pair climbed above the 50% Fib retracement level of the downward move from the 0.6803 swing high to 0.6681 low.
On the upside, the AUD/USD pair is facing resistance near the 0.6750 level. It is near the 61.8% Fib retracement level of the downward move from the 0.6803 swing high to 0.6681 low. There is also a key bearish trend line forming with resistance near 0.6750 on the hourly chart of AUD/USD.
The next major resistance is near the 0.6800 level. A close above the 0.6800 level could start a steady increase in the near term. The next major resistance could be 0.6880.
On the downside, an initial support is near the 0.6725 level. The next support could be the 0.6700 level. The main support is near the 0.6680 level. If there is a downside break below the 0.6680 support, the pair could extend its decline towards the 0.6650 level.
Read Full on FXOpen Company Blog...
Watch FXOpen's July 11 - 15 Weekly Digest Video
In this video, FXOpen UK COO Gary Thomson sums up the week’s happenings and discusses the most significant news reports.
[*] Euro and dollar reach parity.
[*] Inflation in the US rises again.
[*] Analysts' forecasts on Coca-Cola shares.
[*] Watch our short and informative video, and stay updated with FXOpen.
FXOpen YouTube
GBP/USD Eyes Recovery While USD/CAD Is Sliding
GBP/USD could gain pace if it clears the 1.1900 resistance zone. USD/CAD is sliding and could extend losses below the 1.3000 level.
Important Takeaways for GBP/USD and USD/CAD
[*] The British Pound is attempting an upside correction from the 1.1800 support zone.
[*] There is a key bearish trend line forming with resistance near 1.1900 on the hourly chart of GBP/USD.
[*] USD/CAD started a fresh decline from the 1.3220 resistance zone.
[*] There was a break below a connecting bullish trend line with support near 1.3070 on the hourly chart.
GBP/USD Technical Analysis
After facing sellers near 1.2055, the British Pound started a fresh decline against the US Dollar. GBP/USD declined heavily below the 1.2000 support zone.
There was a move below the 1.1900 support zone and the 50 hourly simple moving average. The pair traded as low as 1.1761 and is currently correcting higher. There was a clear move above the 1.1850 resistance zone.
GBP/USD Hourly Chart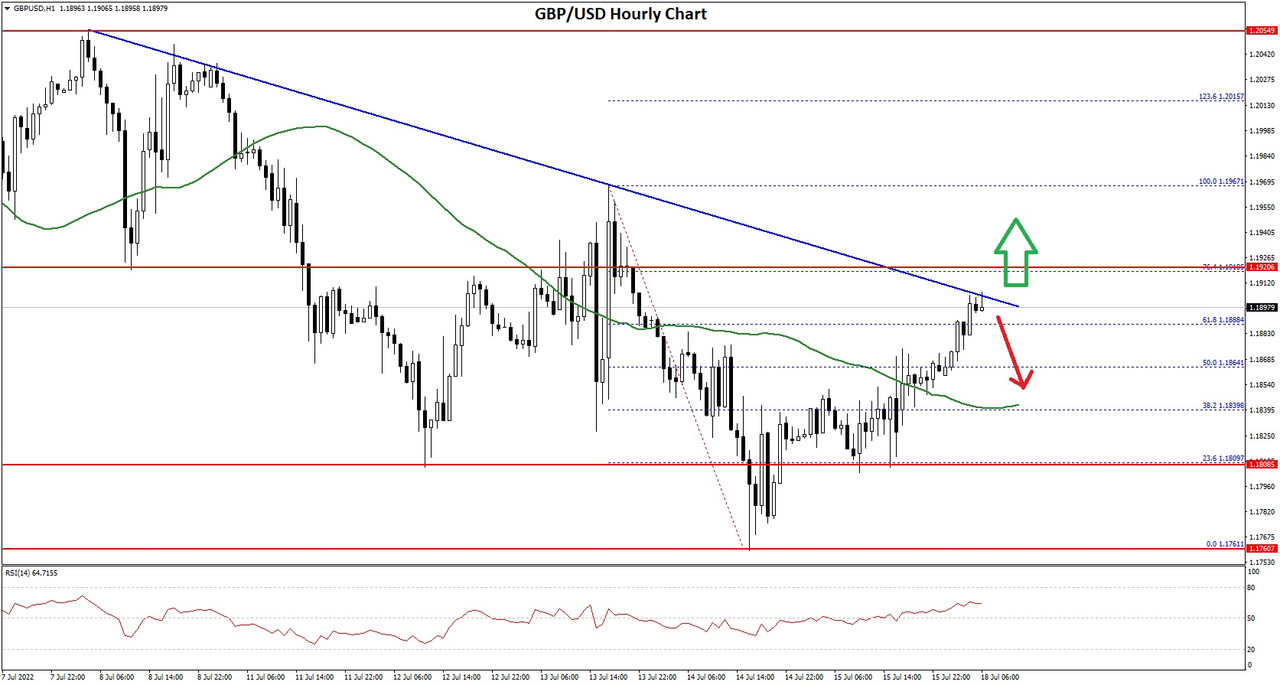
The pair climbed above the 50% Fib retracement level of the downward move from the 1.1967 swing high to 1.1761 low. An immediate resistance is near the 1.1900 level.
There is also a key bearish trend line forming with resistance near 1.1900 on the hourly chart of GBP/USD. The next key resistance is near the 1.1920 level. It is near the 76.4% Fib retracement level of the downward move from the 1.1967 swing high to 1.1761 low.
If there is an upside break above the 1.1920 zone, the pair could rise towards 1.2000. The next key resistance could be 1.2050, above which the pair could gain strength.
On the downside, an initial support is near the 1.1860 area. The first major support is near the 1.1840 level. If there is a break below 1.1840, the pair could extend its decline. The next key support is near the 1.1760 level. Any more losses might call for a test of the 1.1700 support.
Read Full on FXOpen Company Blog...
Gold begins to move upwards, but 1-year low still lingering
Gold has been struggling to maintain the values that it reached during the spring of 2022 over recent months, and by the middle of July it had reached a 1-year low.
Whereas the prices in May had reached $1,980 per ounce, Gold had dropped to $1,700 by July 14.
Today, however, a slight upturn in the value of Gold has begun to make itself evident, and this morning during the Asian trading session, Gold had risen to $1,720 per ounce.
Admittedly, this is still a low value compared to any time during the past twelve months, but the factors which are now beginning to influence the value of gold away from its two-month long decline to the low value reached at the end of last week.
This morning, Gold rose to $1,717 per ounce, which some are attributing to a weakness in the US Dollar. Ordinarily commodities and stores of value such as Gold would not be so influenced by the currency market, but the US Dollar's value is intrinsic to the value of Gold because Gold is valued in US Dollars and bought and settled in US Dollars.
Another US Dollar-related factor which could be contributing to the slight rise in the value of Gold is that the US Federal Reserve Bank intervened to cool down market expectations of a 1.0% rate hike on Friday, which in turn helped the Gold Price to defend the yearly low that it reached on Thursday.
Talk of interest rate increases in the United States are enough to blunt enthusiasm, especially when considering that there have already been a few this year, and that The Index of Consumer Expectations declined to its lowest level since May 1980 at 47.3. These very low figures were released alongside a 0.20% contraction by the US Industrial Production for June to favor Gold buyers or traders of the US Dollar against Gold.
There are talks of a 1% interest rate rise at the next Federal Reserve meeting, and that is a clear indicator that inflation is still a major concern for policymakers in the United States, just as it is in Europe.
The difference is that commodity prices are affected by these economic decisions which involve the US Dollar.
FXOpen Blog
British Pound begins to rise, but still faces challenges
The British Pound has been subjected to an onslaught of challenges recently.
These challenges have not been short term ones, either.
Over the past two years, there have been factors which have had an overreaching effect on the economic circumstances of most Western nations, including government-enforced lockdowns, which were the first in a series of policies which have had a domino effect.
In the United Kingdom, adherence to lockdowns was enforced in a different way to those in many other nations. Instead of policing the movements of people, the British government introduced a furlough scheme which effectively paid people to stay at home.
This has cost the country's coffers a fortune, and along with a £400 billion borrowing program led by Chancellor of the Exchequer (finance minister) Rishi Sunak, it all has to be paid back by a nation whose productivity was adversely affected for over two years.
The inflation and cost of living crisis that ensued has added further woes to the economic situation and the Pound has languished.
Now, however, it has begun to rise again as the forecast for the Consumer Price Index (CPI) will be released today and it is anticipated to be an almost unbelievable 9.1% year-on-year according to a Bloomberg survey. The Bank of England will meet 4th August to decide on how much to hike rates.
This is certainly not good reading for conservative investors, and really shows the extent of the inflation problem.
The anomaly is the US Dollar's strength. The US Dollar remains very strong against all majors, the British Pound being no exception, especially given that the United States is in equally dire straits in terms of inflation which is at a 40 year high.
Productivity in the United States is quite good, however, whereas in the United Kingdom there are still many large organizations which are still not operating at anything like full capacity.
Perhaps another important factor to consider is that the British Prime Minister resigned amid a myriad of chaotic circumstances at the time when the economy is teetering, with many fingers aiming the blame directly at the incumbent government for the state of the nation's finances.
Therefore, the GBP/USD remains in a downtrend like many other markets as overall US Dollar strength continues.
[url="https://fxopen.com/blog/en/"]FXOpen Blog[url]