Daily Market Analysis By FXOpen
EUR/USD and USD/CHF Eye Steady Increase
EUR/USD is struggling to clear the 1.0050 resistance zone. USD/CHF is rising and might climb higher towards the 0.9800 resistance zone.
Important Takeaways for EUR/USD and USD/CHF
[*] The Euro is facing a strong resistance near the 1.0050 zone against the US Dollar.
[*] There is a key bearish trend line forming with resistance near 1.0035 on the hourly chart of EUR/USD.
[*] USD/CHF started a fresh increase after it cleared the 0.9680 resistance zone.
[*] There was a break above a key contracting triangle with resistance near 0.9682 on the hourly chart.
EUR/USD Technical Analysis
This past week, the Euro saw a major decline below the 1.0000 support against the US Dollar. The EUR/USD pair declined below the 0.9950 support level before the bulls appeared.
The pair formed a base above the 0.9900 level and recently started an upside correction. There was a move above the 0.9920 and 0.9950 resistance levels. The pair climbed above the 1.0000 level and the 50 hourly simple moving average.
EUR/USD Hourly Chart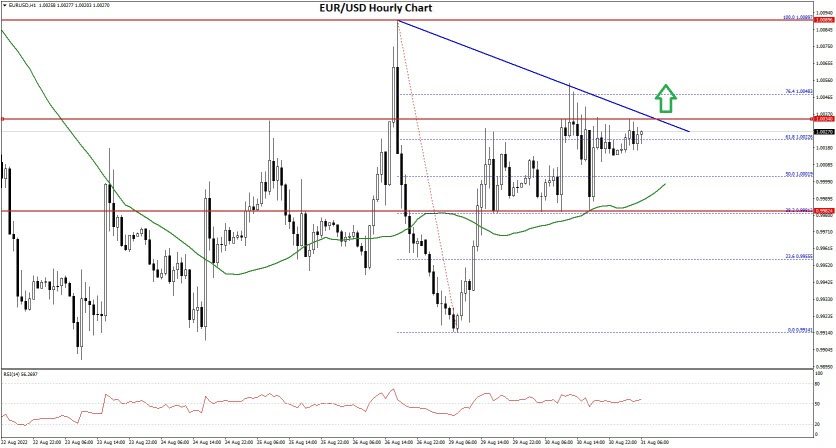
The pair traded above the 50% Fib retracement level of the downward move from the 1.0089 swing high to 0.9914 low. It is now consolidating above the 1.0020 level.
An immediate resistance is near the 1.0040 level. There is also a key bearish trend line forming with resistance near 1.0035 on the hourly chart of EUR/USD. The next major resistance is near the 1.0050 level. It is near the 76.4% Fib retracement level of the downward move from the 1.0089 swing high to 0.9914 low.
A clear move above the 1.0050 resistance zone could set the pace for a larger increase towards 1.0100. The next major resistance is near the 1.0150 zone.
On the downside, an immediate support is near the 1.0000 level. The next major support is near the 0.9950 level. A downside break below the 0.9950 support could start another decline.
VIEW FULL ANALYSIS VISIT - FXOpen Blog
GBP/USD and GBP/JPY Could Extend Losses
GBP/USD started a major decline and traded below 1.1500. GBP/JPY is consolidating above the 160.80 support, with a bearish angle.
Important Takeaways for GBP/USD and GBP/JPY
[*] There is a major bearish trend line forming with resistance near 1.1520 on the hourly chart of GBP/USD.
[*] GBP/JPY declined steadily after it failed to clear the 162.50 resistance zone.
[*] There was a break below a key bullish trend line with support near 161.15 on the hourly chart.
GBP/USD Technical Analysis
This past week, the British Pound started a major decline from the 1.1880 zone against the US Dollar. The GBP/USD pair declined below the 1.1800 support to move into a bearish zone.
There was a steady decline below the 1.1700 level and the 50 hourly simple moving average. The pair even traded below the 1.1620 support zone. The pair traded as low as 1.1460 on FXOpen and is currently consolidating losses.
GBP/USD Hourly Chart
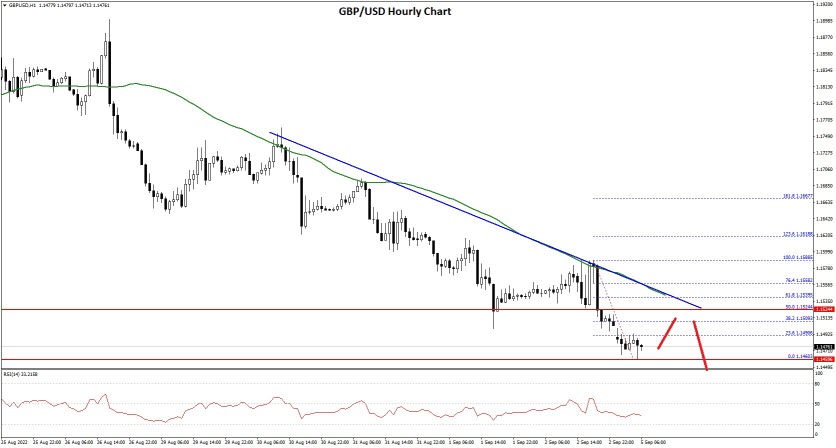
An immediate resistance on the upside is near the 1.1510 level. It is near the 38.2% Fib retracement level of the recent decline from the 1.1588 swing high to 1.1460 level.
The next major resistance is near the 1.1520 level and the 50 hourly simple moving average. There is also a major bearish trend line forming with resistance near 1.1520 on the hourly chart of GBP/USD. The trend line is near the 50% Fib retracement level of the recent decline from the 1.1588 swing high to 1.1460 level.
An upside break above 1.1520 might start a fresh increase towards 1.1550. Any more gains might call for a move towards 1.1585 or even 1.1620. An immediate support is near the 1.1460. The next major support is near the 1.1400 level.
If there is a break below the 1.1400 support, the pair could test the 1.1350 support. Any more losses might send GBP/USD towards 1.1300.
British Pound hits 5-year low against US Dollar
It is not often, nor prudent, to use superlatives to describe the movements of major currencies against each other, however today it can certainly be a time when a superlative is appropriate do describe the performance of the British Pound and its seemingly unstoppable race to the bottom.
Using the word 'tanking' to define the performance of a national economy or currency is somewhat drastic, but in recent weeks, the British Pound certainly has been tanking.
And tank it did again this morning.
As the markets open in London today, the British Pound begins the day at 1.15 against the US Dollar, representing the lowest value that it has reached in more than five years.
In March 2020, when incumbent Prime Minister Boris Johnson and his now infamous aides Chris Whitty and Matt Hancock rolled out the yellow booths and continued to justify their draconian lockdowns which decimated the economy, the British Pound's value only reached a low point of 1.23 against the US Dollar, which is still considerably higher than its value today.
Given that the lockdowns took place in other Western countries at the same time, it is important to note that the British government frittered away over £400 billion of national funds on white elephant projects to keep people out of their places of employment such as furlough, state-backed loans to small businesses and Orwellian track and trace systems.
This emptied the coffers and along with the almost two years of disrupted industry and low productivity as well as a continuing apathy in which tens of thousands of employees are still not going to their offices, the piper now has to be paid.
The British government got itself involved in the geopolitical activity in Russia and Ukraine, and in doing so created its position as an 'unfriendly' country to oil producing Russia, meaning a massive rise in energy prices, although this was mainly a knock-on effect from mainland Europe which relies on Russia for 40% of its natural gas whereas the UK only relies on Russia for less than 10%.
Even so, this situation has created high energy prices, and let's not forget that over 30 energy firms exited the UK market in the third quarter of 2021, many of them having entered administration, creating a market which lacks competition.
The cost of living crisis and spiraling inflation, unaffordable energy bills and low productivity has now created the bearish sentiment in the minds of investors and traders, and the British Pound languishes at a very low point.
It would of course be easy to state that the United States had lockdowns too, and that it also is intent on showing that it wishes to prolong hostilities with Russia, however some US states had no lockdowns at all (Florida and Texas, two of the most populous and highly industrialized states in the Union being two of them), and the productivity levels in the United States are still high.
Yes, inflation is still at its highest point since the 1980s but it is nowhere near as high as that in most mainland European nations, and certainly not as high as that in the United Kingdom which, according to some commercial bank analysts is heading for 18% or more by January this year, with interest rates possibly rising from 1.75 to over 7% next year.
Should that occur, there will likely be an unsustainability in repayment of domestic and commercial loans, hence the lack of confidence in the Pound and general performance of the British economy in the immediate future.
The question is, will we see parity?
VIEW FULL ANALYSIS VISIT - FXOpen Blog...
BTCUSD and XRPUSD Technical Analysis – 06th SEP 2022
BTCUSD: Triple Bottom Pattern Above $19574
Bitcoin was unable to sustain its bearish momentum and after touching a low of 19574 on 01st Sep, it has entered a consolidation channel above the $19000 handle today in the European Trading session.
The price of bitcoin continues to move in a narrow consolidation pattern suggesting that we have touched the bottom, and it is now ready for a bullish reversal trend.
Such a movement also suggests that we are in a phase before a bullish rally could be seen in the markets.
We have also seen a bullish opening gap underpinning the markets this week.
We can clearly see a triple bottom pattern above the $19574 handle which is a bullish reversal pattern because it signifies the end of a downtrend and a shift towards an uptrend.
Bitcoin touched an intraday low of 19703 in the Asian trading session and an intraday high of 20161 in the European trading session today.
Both the STOCH and Williams percent range are indicating overbought levels which means that in the immediate short term, a decline in the prices is expected.
The relative strength index is at 58 indicating a STRONG demand for bitcoin at the current market levels and the continuation of the buying pressure in the markets.
Bitcoin is now moving above its 100 hourly simple moving average and below its 200 hourly exponential moving averages.
All of the major technical indicators are giving a STRONG BUY signal, which means that in the immediate short term, we are expecting targets of 20500 and 22000.
The average true range is indicating HIGH market volatility with a strong bullish momentum.
[*] Bitcoin: bullish reversal seen above $19574
[*] The STOCHRSI is indicating neutral levels
[*] The price is now trading just above its pivot level of $19933
[*] Most of the moving averages are giving a STRONG BUY market signal
Bitcoin: Bullish Reversal Seen Above $19574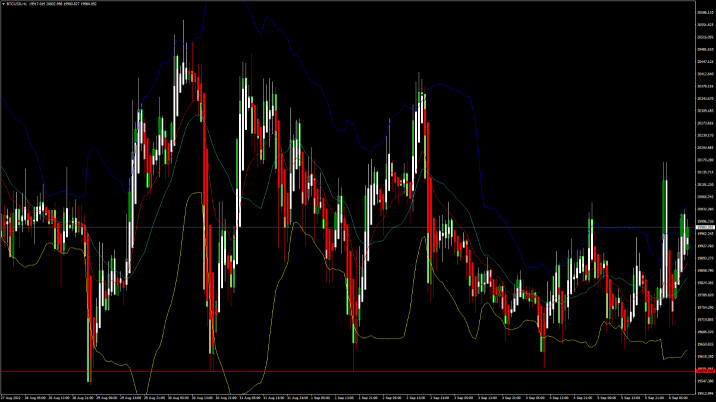
The price of Bitcoin dipped to a low of 19574 after which we can see some buying support and a move towards the consolidation phase in the markets above the $19500 handle.
The adaptive moving average AMA20 is giving a bullish trend reversal signal in the 4-hour time frame.
We can see the formation of a bullish harami cross pattern in the 1-hour time frame indicating the underlying bullish nature of the markets.
We have also detected the formation of a bullish harami pattern in both the daily and 1-hour time frames indicating the bullish scenario.
The immediate short-term outlook for bitcoin is bullish, the medium-term outlook has turned neutral, and the long-term outlook remains neutral under present market conditions.
Bitcoin’s support zone is located at $19000 and the prices continue to remain above these levels for the continuation of the bullish reversal in the markets.
The price of BTCUSD is now facing its classic resistance level of 19989 and Fibonacci resistance level of 20070 after which the path towards 21000 will get cleared.
In the last 24hrs, BTCUSD has increased by 1.03% by 202$ and has a 24hr trading volume of USD 33.957 billion. We can see an increase of 23.80% in the trading volume as compared to yesterday, which appears to be normal.
The Week Ahead
The prices of Bitcoin are moving in a consolidation zone above the $19500 level. At present the bearish outlook has been invalidated with a continuous buying at levels above $19600.
The 10-Year bitcoin trendline is in place with the next targets spotted at levels above $28000.
We can see that the market is trying to build a momentum which can continue to hold up to the $25000 level in the medium term.
The daily RSI is printing at 38 which indicates a eeak demand from the long-term investors.
The prices of BTCUSD will need to remain above the important support levels of $19500 this week.
The weekly outlook is projected at $21500 with a consolidation zone of $20500.
Technical Indicators:
The moving averages convergence divergence (12,26): is at 32.10 indicating a BUY
The ultimate oscillator: is at 54.23 indicating a BUY
The rate of price change: is at 1.018 indicating a BUY
The commodity channel index (14 days): is at 97.59 indicating a BUY
VIEW FULL ANALYSIS VISIT - FXOpen Blog...
British Pound at 20 year low as new Prime Minister takes office
The somewhat lethargic attempt to replace outgoing Prime Minister of the United Kingdom Boris Johnson has come to an end, and Liz Truss has been inaugurated by the current government as the Prime Minister who will replace Boris Johnson.
The result of this selection process concluded yesterday to a varied discourse among the business community and the electorate, however it has been marked by the already flagging British economy having reached an unenviable milestone, this being the British Pound having sunk to its lowest point in 20 years.
Although the value of the Pound against its major peers turned around on Monday, reversing some of its earlier losses to return to the flatline, it still languishes at 1.16 against the US Dollar today, having risen only slightly from the upper end of the 1.15 range yesterday which is its lowest value in two whole decades.
Faced with inflation that may reach 20% by January, and a total lack of confidence in the economic conditions in the United Kingdom by many investors and a large proportion of the cash-strapped public who have seen the national coffers plundered during the period in which Boris Johnson was in office to the tune of hundreds of billions on lockdown-related schemes, green initiatives and his voluntary involvement in the geopolitical turmoil facing Russia and Ukraine.
It appears that the overall global FX market has become used to the similarly escalating levels of inflation across Europe and North America, and have begun to focus on specific differences between these economic centers rather than on a common issue surrounding inflation which affects all of the West relatively equally.
Therefore, the volatility in the currency markets that is surrounding the majors is stemming from another set of metrics, because if it was all about inflation, there would be similar considerations on all currencies and therefore not much volatility.
The Eurozone has managed to stay ahead during the period at which the Pound has been tanking, and the US Dollar has been the strong currency to measure the extent to which the Pound has been tanking.
Uncertainty looms as the relatively unproven Liz Truss takes office, her views already having been cast on involvement in the Ukraine/Russia political situation where she rather rashly stated that she would like to 'destroy the Russian economy'. Not really the words that should be coming from an elected official.
In fact, the sanctions have strengthened the ruble, and created extreme demand for oil, therefore adding to the economic woes faced by Western markets.
These are uncertain times, and as summer gives way to autumn, all eyes are on energy prices, the affordability of domestic heating in the winter being another major factor toward the weakening of the Pound.
Volatility is abound, folks!
VIEW FULL ANALYSIS VISIT - FXOpen Blog...
Stark reality of China's lockdowns: Oil and FTSE 100 down
Perhaps somewhat surprisingly, trade figures released this week by the Chinese government have been enough of a disappointment to affect the price of raw commodities.
China is by far the most productive country on earth. Its massive population coupled to its might as the world's manufacturing center has propelled it into a league of its own to the extent that new cities which were only built between ten and fifteen years ago across the country are now home to between fifteen and twenty million people per city and it is not uncommon to see Rolls Royce cars and huge corporate headquarters dominating the streets and skylines as if these metropoli had hundreds of years of prosperity behind them.
China's massive output which feeds its own enormous domestic market as well as provides pretty much everything to the entire world is unsurprisingly the reason why it is the highest importer and consumer of crude oil in the world by a very long way.
Therefore, when figures in China are down, this is enough to affect the price of crude oil as a global commodity.
Rather unbelievably, the Chinese government, which operates a single-party, communist state in which the entire economy is centralized and has massive government involvement, is engaging in draconian lockdowns, something that has been going on for over two years now, with its obedient population complying to the letter.
Due to these lockdowns which are still taking place in several major cities, the year-on-year figures showing exports growth of 7.1% and imports up by just 0.3% in August were both below expectations.
The export growth is an important metric here, because importing anything other than raw materials into China (an activity which is supervised by the government), is against the law as it contravenes the communist ethos of the government.
Exporting products made for external markets is China's strength, and a slow growth of such a massive mainstay of the economy is an indictor that a bit less oil would be required if productivity is down.
The price of Brent crude was below $92 a barrel at the start of London trading this morning, which has had an effect on mining and exploration company stocks which are listed on the London Stock Exchange.
China’s worse-than-expected trade figures led specifically toward energy and mining stocks opening lower, leaving the FTSE 100 index down 78.76 points at 7221.68.
It's still above the 7220 mark, which is not a catastrophe by any means, but the lowering value of oil globally and energy company stocks on London's markets is an indicator toward how much of an influencer Chinese productivity is on global markets.
To put some actual figures on this, Rio Tinto lost 2.5% and Anglo American fell by just under 2%, while BP retreated 1.5% or 6.5p to 446.15p.
China therefore remains the world's most influential market and this serves as a reminder of its might, whether things are going well or not so well!
VIEW FULL ANALYSIS VISIT - FXOpen Blog...
Disclaimer: CFDs are complex instruments and come with a high risk of losing your money.
ETHUSD Technical Analysis – 08th SEP, 2022
ETHUSD: Hammer Pattern Above $1490
Ethereum was unable to sustain its bearish momentum and after touching a low of 1492 on 07th Sep started to correct upwards against the US dollar, crossing the $1600 handle in the European trading session today.
We can see a continued buying pressure since yesterday and the formation of a bullish trendline from $1490 towards $1685 level.
We can clearly see a hammer pattern above the $1490 handle which is a bullish pattern and signifies the end of a bearish phase and the start of a bullish phase in the markets.
ETH is now trading just above its pivot level of 1613 and moving into a strong bullish channel. The price of ETHUSD is now testing its classic resistance level of 1630 and Fibonacci resistance level of 1647 after which the path towards 1700 will get cleared.
The relative strength index is at 58 indicating a STRONGER demand for Ether and the continuation of the uptrend in the markets.
We can see the aroon indicator giving a bullish trend in the weekly time frame.
We have also detected a moving average crossover pattern between the MA50 & MA100 in the 30-minute time frame.
The STOCHRSI is indicating an OVERSOLD market, which means that the prices are expected to correct upwards in the short-term range.
Most of the technical indicators are giving a STRONG BUY market signal.
Most of the moving averages are giving a BUY signal and we are now looking at the levels of $1700 to $1800 in the short-term range.
ETH is now trading Above both the 100 & 200 hourly simple and exponential moving averages.
[*] Ether: bullish reversal seen above the $1490 mark
[*] The short-term range appears to be strongly BULLISH
[*] ETH continues to remain above the $1600 levels
[*] The average true range is indicating LESS market volatility
Ether: Bullish Reversal Seen Above $1490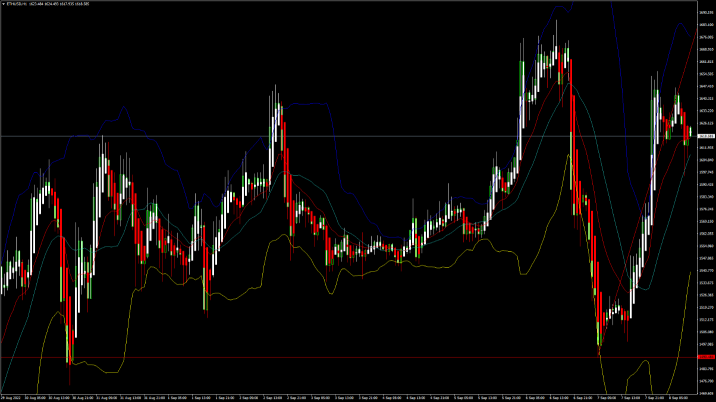
ETHUSD is moving into a strong bullish channel with the prices trading above the $1600 handle in the European trading session today.
ETH touched an intraday high of 1656 in the Asian trading session and an intraday low of 1597 in the European trading session today.
A three white soldiers pattern is visible in the 30-minutes time frame indicating the underlying bullish nature of the markets.
We can see the formation of a bullish harami cross pattern in the 15-minute time frame which indicates that now we are heading towards the $1800 mark.
The daily RSI is printing at 50 indicating a neutral demand in the long-term range.
Ethereum continues to move into a rising trend channel which is expected to continue in the short-term range.
The key support levels to watch are $1515 and $1581, and the prices of ETHUSD need to remain above these levels for the continuation of the bullish reversal in the markets.
ETH has increased by 6.68% with a price change of 101$ in the past 24hrs and has a trading volume of 18.368 billion USD.
We can see a decrease of 12.89% in the total trading volume in the last 24 hrs which appears to be normal.
The Week Ahead
On the upside the next visible targets are 1655 which is a 38.2% retracement from 4-week low, and 1726 which is a 50% retracement from 4-week high/low.
The price of Ethereum is now testing its immediate resistance zone located at $1700 and we are likely to witness a rally in the price once it touches these levels.
The immediate short-term outlook for Ether has turned strongly BULLISH, the medium-term outlook has turned NEUTRAL, and the long-term outlook for Ether is NEUTRAL in present market conditions.
The prices of ETHUSD will need to remain above the important support level of $1500 this week.
The weekly outlook is projected at $1800 with a consolidation zone of $1700.
Technical Indicators:
The relative strength index (14): is at 58.32 indicating a BUY
The moving averages convergence divergence (12,26): is at 10.23 indicating a BUY
The rate of price change: is at 3.32 indicating a BUY
The ultimate Oscillator: is at 58.98 indicating a BUY
VIEW FULL ANALYSIS VISIT - FXOpen Blog...
Disclaimer: CFDs are complex instruments and come with a high risk of losing your money.
Watch FXOpen's September 5 - 9 Weekly Digest Video
In this video, FXOpen UK COO Gary Thomson sums up the week’s happenings and discusses the most significant news reports.
[*] British Pound at 20 year low as new Prime Minister takes office
[*] New extreme for the yen
[*] Has Apple's presentation affected the stock price?
[*] Stark reality of China's lockdowns: Oil and FTSE 100 down
Watch our short and informative video, and stay updated with FXOpen.
FXOpen YouTube
BTCUSD and XRPUSD Technical Analysis – 13th SEP 2022
BTCUSD: Inverted Hammer Pattern Above $19025
Bitcoin was unable to sustain its bearish momentum and after touching a low of 18567 on 07th Sep, it started to correct upwards crossing the $22000 handle today in the European trading session.
The price of Bitcoin continues to correct upwards due to the increased buying pressure and more upsides are expected towards the $25000 levels.
We can see a bullish price crossover with the adaptive moving average AMA50 in the 15-minute time frame.
We have also seen a bullish opening gap underpinning the markets this week.
We can clearly see an inverted hammer pattern above the $19025 handle which is a bullish reversal pattern because it signifies the end of a downtrend and a shift towards an uptrend.
Bitcoin touched an intraday low of 22067 in the Asian trading session and an intraday high of 22553 in the European trading session today.
Both the STOCH and Williams percent range are indicating overbought levels which means that in the immediate short term a decline in the prices is expected.
The relative strength index is at 71 indicating a very strong demand for bitcoin at the current market levels and the continuation of the buying pressure in the markets.
Bitcoin is now moving above its 100 hourly simple moving average and below its 200 hourly exponential moving averages.
All of the major technical Indicators are giving a STRONG BUY signal, which means that in the immediate short term we are expecting targets of 24000 and 25000.
The average true range is indicating LESS market volatility with a strong bullish momentum.
[*] Bitcoin: bullish reversal seen above $19025.
[*] STOCHRSI is indicating an oversold level.
[*] The price is now trading just above its pivot level of $22332.
[*] All of the moving averages are giving a STRONG BUY market signal.
Bitcoin: Bullish reversal seen above $19025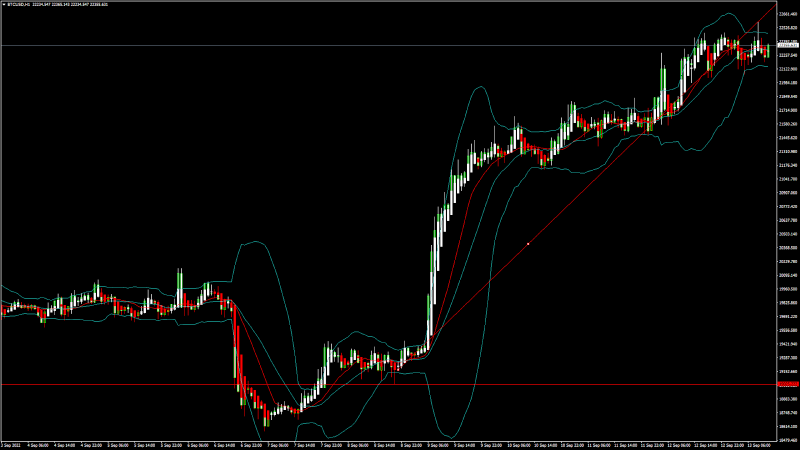
The price of bitcoin is forming an ascending channel, with the current price action indicating a move towards the consolidation phase above the $22000 handle.
We can see the formation of a bullish harami pattern in the 2-hourly time-frame indicating the underlying bullish nature of the markets.
We have also detected the formation of a bullish engulfing line in the 1-hourly time frame indicating the bullish scenario.
The immediate short-term outlook for bitcoin is bullish, the medium-term outlook has turned neutral, and the long-term outlook remains neutral under present market conditions.
Bitcoin’s support zone is located at $21000 and the price continues to remain above these levels for the continuation of the bullish reversal in the markets.
The price of BTCUSD is now facing its classic resistance level of 22502 and Fibonacci resistance level of 22731 after which the path towards 23000 will get cleared.
In the last 24hrs BTCUSD has increased by 0.95% by 211$ and has a 24hr trading volume of USD 43.846 billion. We can see a decrease of 2.98% in the trading volume as compared to yesterday, which appears to be normal.
The Week Ahead
The price of bitcoin is moving in a consolidation zone above the $22000 levels. At present the price is moving into a narrow range between the 22000 and 22500 levels.
We can see that the price of bitcoin is super bullish and we are heading towards the $30000 handle in the medium term range.
The daily RSI is printing at 61 which indicates a very strong demand from the long-term investors.
The price of BTCUSD will need to remain above the important support levels of $21000 this week.
The weekly outlook is projected at $25000 with a consolidation zone of $24500.
Technical Indicators:
The moving averages convergence divergence (12, 26): is at 564.30 indicating a BUY.
The ultimate oscillator: is at 57.64 indicating a BUY.
The rate of price change: is at 5.34 indicating a BUY.
The commodity channel index (14): is at 105.75 indicating a BUY.
VIEW FULL ANALYSIS VISIT - FXOpen Blog...
EUR/USD Trims Gains, USD/JPY Aims New High
EUR/USD started another decline from the 1.0200 resistance. USD/JPY is rising and might soon clear the key 145.00 resistance zone.
Important Takeaways for EUR/USD and USD/JPY
[*] The Euro started a fresh decline and even traded below the 1.0020 support.
[*] There was a break below a major bullish trend line with support near 1.0140 on the hourly chart of EUR/USD.
[*] USD/JPY started a fresh increase after it remained well bid above the 141.50 support.
[*] There is a key bullish trend line forming with support near 142.30 on the hourly chart.
EUR/USD Technical Analysis
This past week, the Euro was able to recover above the 1.0100 level against the US Dollar. The EUR/USD pair even broke the 1.0150 level, but the bears were active near the 1.0200 zone.
A high was formed near 1.0197 on FXOpen and the pair started a fresh decline. There was a clear move below the 1.0150 and 1.0120 support levels. The pair declined below the 50% Fib retracement level of the upward move from the 0.9864 swing low to 1.0197 high.
EUR/USD Hourly Chart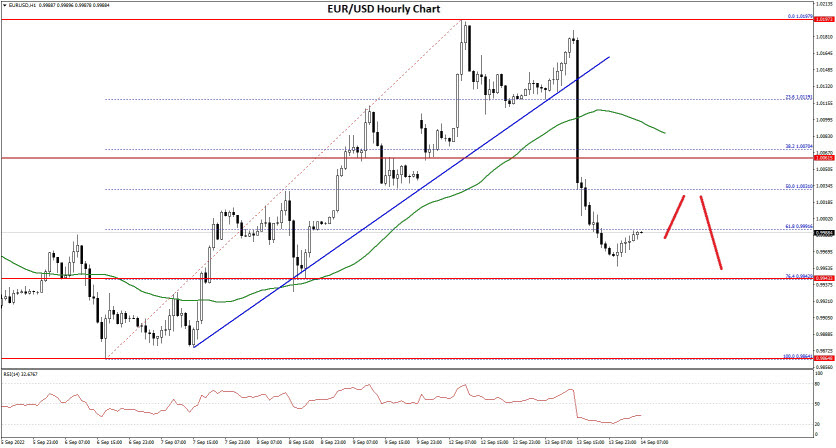
Besides, there was a break below a major bullish trend line with support near 1.0140 on the hourly chart of EUR/USD. The pair is now trading below the 1.0050 level and the 50 hourly simple moving average.
An immediate resistance on the upside is near the 1.0000 level. The next major resistance is near the 1.0030 level. An upside break above 1.0030 could set the pace for a steady increase. In the stated case, the pair might revisit 1.0080.
Any more gains might send the pair towards 1.0120. If not, the pair might drop and test the 0.9950 support. The next major support is near 0.9920, below which the pair could drop to 0.9860 in the near term.
VIEW FULL ANALYSIS VISIT - FXOpen Blog...