Daily Market Analysis By FXOpen
British Pound crashes against the US Dollar on first working day of 2023
Today represents the very first full working day of 2023 across many markets in the Western World, and already the currency markets have got off to a dramatic start.
The British Pound, which made a rebound at the end of last year from its months-long decline in value, has once again taken a dive.
As the markets opened this morning, the British Pound dropped in value against the US Dollar, diving from 1.21 against the US Dollar at 7.30am UK time, to 1.19 against the US Dollar just 2 hours later.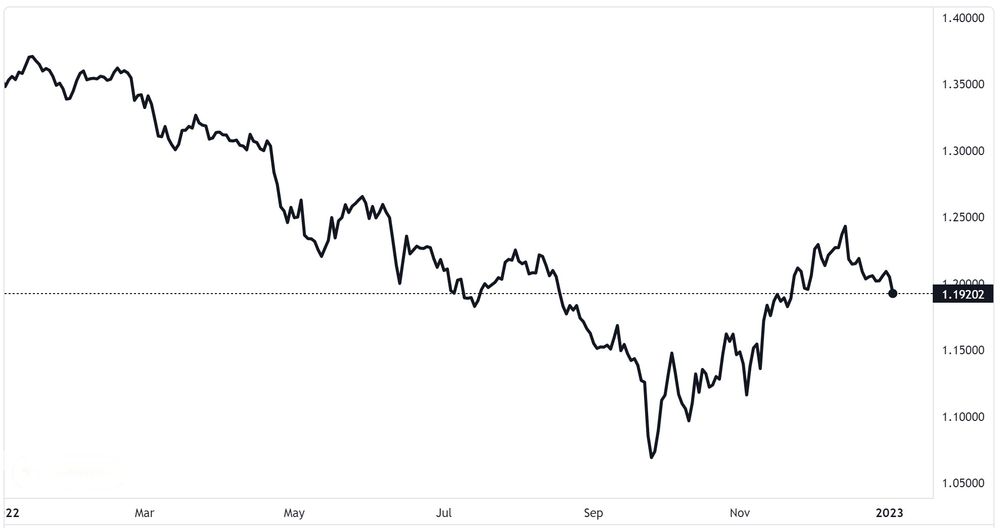
This sudden collapse in value has almost wiped out the gains made by the Pound during the final weeks of 2022, which saw the Pound begin to climb back up against the US Dollar from its lowly 1.08 value in mid to late September when it 'bottomed out' against the US Dollar and many market analysts were looking at the possibility of parity between the two major currencies.
Had that taken place, it would have represented an historic moment because the Pound has been the most valuable currency in the world since the mid 1920s!
It did not, however, reach anywhere near parity with the US Dollar and the Pound began to rise in value once again during November and December.
Today's crash in value represents the Pound's lowest point in over two months, which happened suddenly this morning.
Volatility in the currency markets used to be a very rare thing, and for over two decades until 2020, there was very little movement on the major currencies to the extent that entire trading strategies were built on the basis of low volatility.
Now, with rampant inflation across many Western markets, and fears of the UK's economic policy for the year being a damp squib, there was a strong demand for the US Dollar this morning as the markets opened, resulting in this sudden gulf in values.
It appears that despite the rollercoaster ride that occurred in 2022, there is still room for a surprise sudden movement in the major currency markets.
VIEW FULL ANALYSIS VISIT - FXOpen Blog...
Disclaimer: This forecast represents FXOpen Companies opinion only, it should not be construed as an offer, invitation or recommendation in respect to FXOpen Companies products and services or as financial advice.
EUR/USD and USD/CHF 2023 Chart Outlook
EUR/USD gained pace above the 1.0200 resistance zone. USD/CHF is declining and remains at a risk of more losses below the 0.9200 support.
Important Takeaways for EUR/USD and USD/CHF
[*] The Euro started a fresh increase above the 1.0200 resistance against the US Dollar.
[*] There was a break above a major bearish trend line with resistance near 0.9880 on the daily chart of EUR/USD.
[*] USD/CHF started a fresh decline below the 0.9750 and 0.9400 support levels.
[*] There was a break below a key rising channel with support near 0.9840 on the daily chart.
EUR/USD Technical Analysis
This week, the Euro started a steady increase from the 0.9600 zone against the US Dollar. The EUR/USD pair gained pace above the 1.0000 level to move into a bullish zone.
The pair even climbed above the 1.0200 resistance and settled above the 50-day simple moving average. During the increase, there was a break above a major bearish trend line with resistance near 0.9880 on the daily chart of EUR/USD.
EUR/USD Daily Chart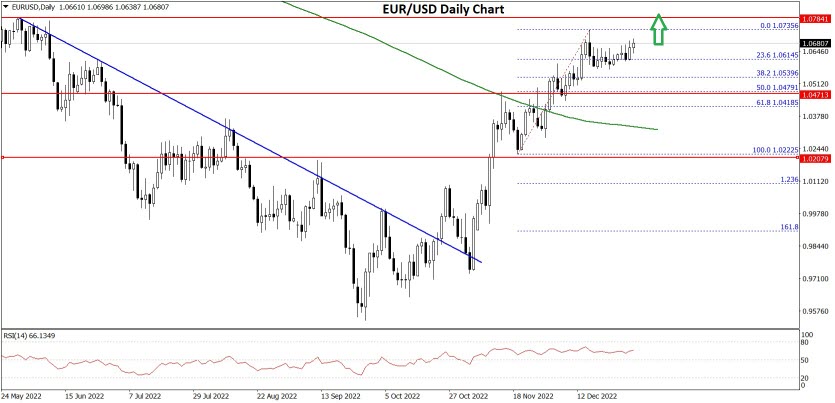
Moreover, there was a move above the 1.0500 level. It traded as high as 1.0735 on FXOpen and is currently consolidating gains. There was a move below the 1.0650 level. The pair traded below the 23.6% Fib retracement level of the upward move from the 1.0223 swing low to 1.0735 high.
On the downside, an immediate support is near the 1.0500 level. The 50% Fib retracement level of the upward move from the 1.0223 swing low to 1.0735 high is also near the 1.0500 zone.
The next major support is near the 1.0220 level. A downside break below the 1.0220 support could start another decline towards the 1.0000 handle.
An immediate resistance is near the 1.0750 level. The next major resistance is near the 1.0800 level. A clear move above the 1.0800 resistance zone could set the pace for a larger increase towards 1.1000. The next major resistance is near the 1.1200 zone.
VIEW FULL ANALYSIS VISIT - FXOpen Blog...
Disclaimer: This forecast represents FXOpen Companies opinion only, it should not be construed as an offer, invitation or recommendation in respect to FXOpen Companies products and services or as financial advice.
Oil price on the backfoot in early 2023 despite high demand
If the year 2022 can be remembered for any recurring feature in terms of demand for commonly traded commodities, it can be remembered as a year of high energy prices across many Western countries, with oil being one of the most prized consumable commodities of the year.
In the summer of 2022, Fuel stations across Europe and the United Kingdom were charging in excess of 2 euros / 2 pounds for a liter of unleaded fuel for vehicles, and energy costs for domestic heating, reliant on gas or oil, were soaring, especially in the United Kingdom where approximately 30 energy companies became insolvent and left the market in late 2021, resulting in far less competition at a time during which the raw material itself was in huge demand for geopolitical reasons.
Demand remains very high for crude oil, and as many European nations continue to enforce draconian sanctions on one of the world's largest suppliers of oil - the Russian Federation - prices have been volatile throughout the last 12 months.
Interestingly, however, Brent Crude Oil (WTI) started the year 2023 in a stagnant position.
Indeed, Brent Crude Oil futures for February 2023 settlement are 1.86% down compared to the end of December and currently valued at approximately $78.1 per barrel.
Stocks in 'big oil' companies are still quite strong, however, as publicly listed North American oil giantr ExxonMobil is reportedly set to report $56 billion in profit for 2022, marking the highest number ever achieved by a non-state-owned company and almost triple its 2021 result.
Whether these companies are riding on their bonanza year which 2022 turned out to be is yet to be seen, as it is possible that investors may view these massive profits with caution if 2023's initial few weeks does not demonstrate the same level of high prices as 2022 did.
If the natural gas market is any indicator of the performance of other commodities which are equally affected by the same geopolitical constraints, it is worth noting that natural gas prices are now back down to the level they were at this time a year ago, before the war started and before any sanctions on Russian gas companies were imposed which made it impossible for customers in Europe to pay Russian suppliers for gas, resulting in curtailing of supply.
It appears that those which owe money are now being chased, and just recently a Russian court approved an order that the assets of German industrial gas firm Linde worth $500 million be frozen at the request of a Gazprom-led joint venture, citing unfulfilled commitments.
There is a 'new normal' now that the markets are beginning to adjust to.
This morning, during the Asian trading session, Brent Crude oil crept back up slightly to the $79 per barrel mark, but, apart from a dip to $76 per barrel in mid-December, today's value is the lowest it has been since December 2021, before all of the sanctions began.
VIEW FULL ANALYSIS VISIT - FXOpen Blog...
Disclaimer: This forecast represents FXOpen Companies opinion only, it should not be construed as an offer, invitation or recommendation in respect to FXOpen Companies products and services or as financial advice.
ETHUSD and LTCUSD Technical Analysis – 05th JAN, 2023
ETHUSD: Bullish Engulfing Pattern Above $1181
Ethereum was unable to sustain its bearish momentum and after touching a low of 1181 on 30th Dec, the price started to correct upwards against the US dollar moving into a consolidation channel above the $1200 handle today in the European trading session.
We can see the formation of bullish engulfing lines in the weekly time frame.
We can clearly see a bullish engulfing pattern above the $1181 handle which is a bullish pattern and signifies the end of a bearish phase and the start of a bullish phase in the markets.
ETH is now trading just below its pivot level of 1251 and moving into a consolidation channel. The price of ETHUSD is now testing its classic resistance level of 1254 and Fibonacci resistance level of 1257 after which the path towards 1300 will get cleared.
The relative strength index is at 69.10 indicating a STRONG demand for Ether and the continuation of the buying pressure in the markets.
The average directional index is indicating a NEUTRAL level, which means that the price is expected to remain under consolidation in the short-term range.
Most of the technical indicators are giving a BUY market signal.
Most of the moving averages are giving a BUY signal at the current market levels of $1250.
ETH is now trading Above its 100 hourly simple and 200 hourly exponential moving averages.
[*] Ether: bullish reversal seen above the $1181 mark
[*] The short-term range appears to be mildly bullish
[*] ETH continues to remain above the $1250 levels
[*] The average true range is indicating HIGH market volatility
VIEW FULL ANALYSIS VISIT - FXOpen Blog...
Disclaimer: This forecast represents FXOpen Companies opinion only, it should not be construed as an offer, invitation or recommendation in respect to FXOpen Companies products and services or as financial advice.
GBP/USD Gains Pace While EUR/GBP Corrects Lower
GBP/USD started a fresh increase above the 1.2200 resistance zone. EUR/GBP is slowly moving lower below the 0.8880 support zone.
Important Takeaways for GBP/USD and EUR/GBP
[*] The British Pound started a fresh increase above the 1.2200 resistance against the US Dollar.
[*] There is a key bullish trend line forming with support near 1.2220 on the hourly chart of GBP/USD.
[*] EUR/GBP started a downside correction below the 0.8880 support zone.
[*] There was a break below a connecting bullish trend line with support near 0.8860 on the hourly chart.
GBP/USD Technical Analysis
The British Pound remained well bid above the 1.2120 level against the US Dollar. The GBP/USD pair gained pace above the 1.2200 level to move into a positive zone.
There was a clear move above the 1.2220 level and the 50 hourly simple moving average. The bulls seem to be in control and a high is formed near 1.2287 on FXOpen. It is now consolidating gains and showing positive signs above the 1.2250 level.
GBP/USD Hourly Chart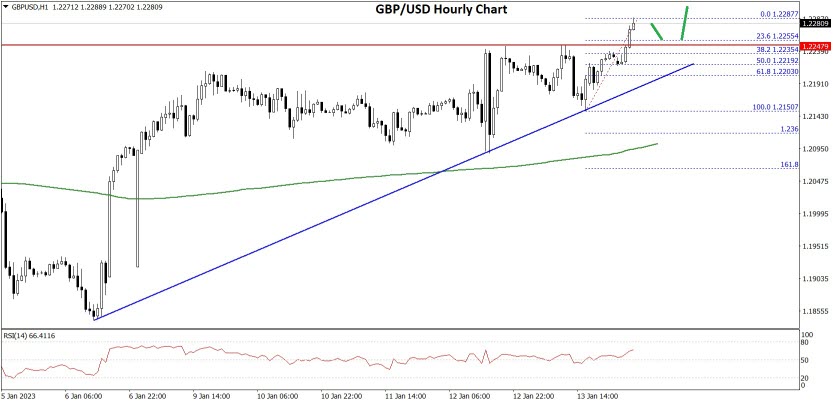
On the upside, an initial resistance is near the 1.2300 level. The first major resistance is near the 1.2320 level. A clear move above the 1.2320 level could spark a decent increase.
The next major resistance sits near the 1.2200 level. Any more gains might send the pair towards the 1.2400 resistance zone. On the downside, an initial support is near the 1.2250 level or the 23.6% Fib retracement level of the upward move from the 1.2150 swing low to 1.2287 high.
The next major support is near the 1.2220 level. There is also a key bullish tend line forming with support near 1.2220 on the hourly chart of GBP/USD.
The trend line is near the 50% Fib retracement level of the upward move from the 1.2150 swing low to 1.2287 high. Any more losses could lead the pair towards the 1.2150 support zone.
VIEW FULL ANALYSIS VISIT - FXOpen Blog...
Disclaimer: This Forecast represents FXOpen Companies opinion only, it should not be construed as an offer, invitation or recommendation in respect to FXOpen Companies products and services or as financial advice.
Crypto winter giving way to Crypto spring? Bitcoin suddenly wakes up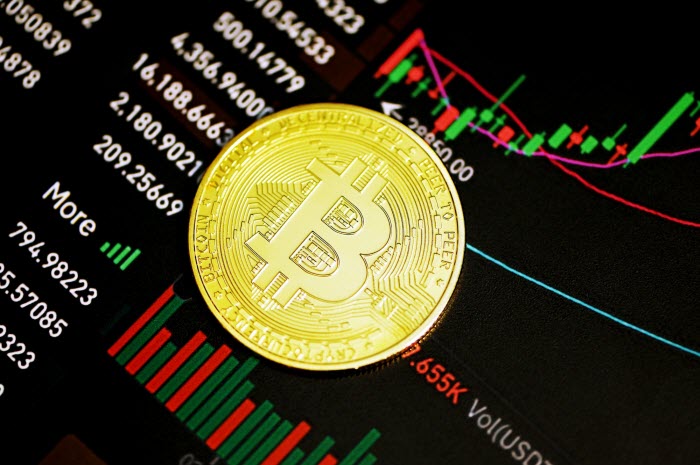
The long, drawn-out period which has lasted several months in which Bitcoin, previously as volatile as a piece of magnesium ribbon over a naked flame, has been utterly stagnant.
The days of $60,000 values and cliffhanger tweets by influencers suddenly crashing and inflating the value of the world's most valuable cryptocurrency seem a distant memory.
If 2021 was the year of the Bitcoin-related rollercoaster ride, 2022 has been a year of absolute hibernation, representing a contrast so great that it is hard to imagine that it is the same investment vehicle.
The doldrums which have existed for a few months now have been dubbed 'crypto winter' by analysts and journalists, a term used to depict the low values and lack of market movement which has overshadowed the previous enthuaiasm for Bitcoin trading.
Today, however, during the Asian session, Bitcoin suddenly rose in value by a substantial amount, to $21,382 by 2.25am UK time.
On Thursday last week, Bitcoin was languishing at $18,880 therefore the rise over just 3 working days has been over $2,000.
As the price of Bitcoin headed toward the $20,000 mark at the beginning of this week, the total cryptocurrency market capitalization figure began to approach £1 trillion.
This is the first time that Bitcoin has passed the $20,000 mark since before the collapse of cryptocurrency exchange FTX in November.
Last week, cryptocurrencies began to rise in value, with Ethereum, the world's second most popular cryptocurrency, having also increased its capitalization leading to a speculation among some analysts that the crypto winter may be over and some degree of resurgence is beginning.
Of course, these small increases are a far cry from the huge surges in value experienced in 2021, but they are significant when considering the totally flat values that have been in place for a few months.
Crypto-denominated stocks are also on the up, largely due to the sudden bullish approach to cryptocurrencies that has come about, and some pundits are considering that the lingering issue of continued inflation among centrally issued currencies and centralized economies dogged by recessions and rising costs are waking up the prices of cryptocurrencies as people look toward another year of high costs and depreciating fiat currencies and search for alternatives.
These opinions all amount to guesswork, however, but what is for sure is that there is a definitive sudden interest in cryptocurrencies once again and that is clearly demonstrated by looking at the chart patterns this morning.
VIEW FULL ANALYSIS VISIT - FXOpen Blog...
Disclaimer: This Forecast represents FXOpen Companies opinion only, it should not be construed as an offer, invitation or recommendation in respect to FXOpen Companies products and services or as Financial Advice.
FTSE 100 still at highest levels in 5 years despite this morning's drop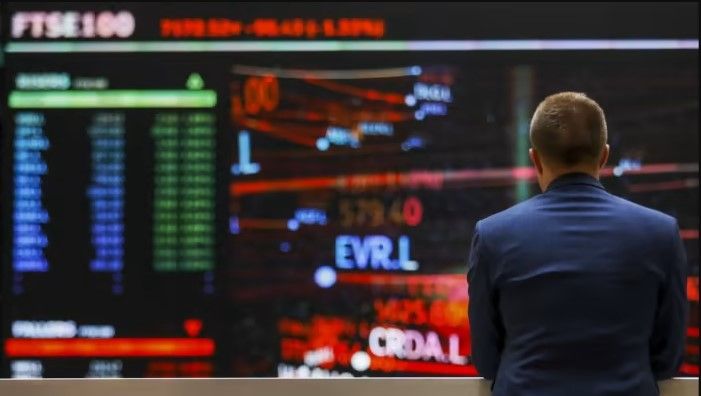
The performance of the 100 most prestigious companies listed on the London Stock Exchange has made for exciting viewing over recent days, with the FTSE 100 index that tracks them having rocketed in value.
Last week, the FTSE 100 index raced to its highest point in over three years, with some analysts across the City of London having begun to wonder whether it may reach 8,000 points.
Yesterday, the rally continued, and the FTSE 100 reached its highest position in five years, which is a remarkable milestone, as the trading day ended at a very high 7,856.
This morning, the trading bonanza came to an abrupt end, as a sudden drop took place at 9.00am during the London trading session, signaling a break in the FTSE 100 index's almost unstoppable rally.
However, even after such a drop, the FTSE 100 was still standing at 7,845 points which is still its highest point in five years apart from yesterday's peak.
The sudden drop was quickly reversed, and by 9.30am there was a slight movement upwards once again, which by 9.45am resulted in a climb back to 7,849 points.
Now it is hard to tell whether this upward movement will continue and cancel out this morning's drop entirely, or whether this is the end of the massive rally experienced by the FTSE 100 index over recent weeks.
Interestingly, in this age of high technology in which internet giants such as Amazon and Google dominate the world's corporate stage, NASDAQ has been hit badly with weakening overall stock values as the US tech stocks and electric vehicle manufacturers' poor performance has had an impact.
Meanwhile the FTSE 100 which tracks traditional firms such as airlines, mining companies, banks, pharmaceuticals, retail giants, supermarkets and healthcare firms among others, is booming.
All this with a backdrop of a weak economy in the United Kingdom and high inflation compared to greater production output and lower inflation in the United States.
For the moment, it certainly appears that there is life in 'low tech' and that London's trading floor is a hive of activity.
VIEW FULL ANALYSIS VISIT - FXOpen Blog...
Disclaimer: This Forecast represents FXOpen Companies opinion only, it should not be construed as an offer, invitation or recommendation in respect to FXOpen Companies products and services or as Financial Advice.
BTCUSD and XRPUSD Technical Analysis – 17th JAN 2023
BTCUSD: Three Inside Up Pattern Above $17323
Bitcoin continues its bullish momentum from last week and after touching a low of $17323 on 11th Jan, the price started to correct upwards against the US Dollar and is now ranging above the $21000 handle in the European trading session today.
We can see an upwards rally in the BTCUSD which managed to touch the level of $21390 on 16th Jan.
We can clearly see a three inside up pattern above the $17323 handle which is a bullish reversal pattern because it signifies the end of a downtrend and a shift towards an uptrend.
Bitcoin touched an intraday high of 21288 and an intraday low of 20952 in the Asian trading session today.
The price of bitcoin is ranging near a new record high of 1 month.
The ichimoku is indicating a bullish crossover with tenkan and kijun in the 30-minute time frame.
Both the STOCH and Williams percent range are indicating overbought levels which means that in the immediate short term, a decline in the prices is expected.
The resistance of the channel is broken in the 15-minute time frame indicating bullish trends.
The relative strength index is at 72.09 indicating a very strong demand for bitcoin, and the continuation of the buying pressure in the markets.
Bitcoin is now moving above its 100 hourly simple moving average and above its 100 hourly exponential moving averages.
Most of the major technical indicators are giving a buy signal, which means that in the immediate short term, we are expecting targets of 22000 and 23500.
The average true range is indicating less market volatility with a strong bullish momentum.
[*] Bitcoin: bullish continuation seen above $17323
[*] The STOCHRSI is indicating an OVERSOLD level
[*] The price is now trading just below its pivot level of $21167
[*] The short term range is strongly bullish
Bitcoin: Bullish Continuation Seen Above $17323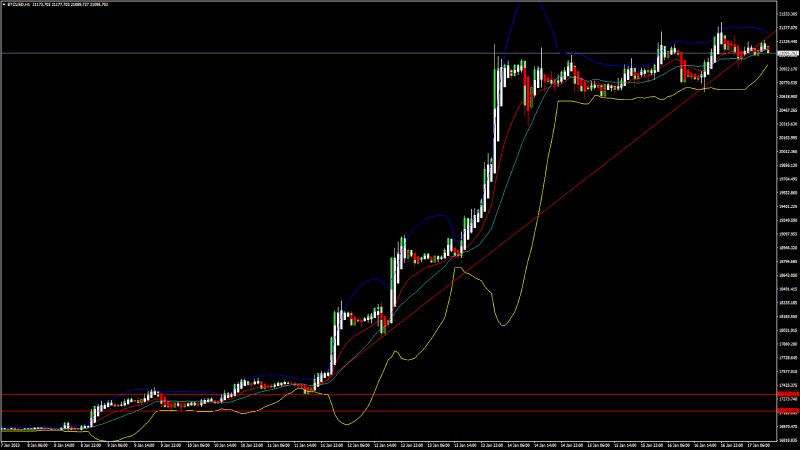
The price of Bitcoin witnessed a rally after crossing the $18000 levels, and now we can see some market consolidation above the $21000 levels.
After the consolidation phase is over, we are expecting upside moves in the range of $22000 to $24000 levels.
There is an ascending channel forming with the current support at $17379 which is a 14-3 day raw stochastic at 20%.
We can see the formation of a bullish trend reversal pattern with the adaptive moving average AMA20 in the 15-minute time frame.
The immediate short-term outlook for bitcoin is strongly bullish, the medium-term outlook has turned bullish, and the long-term outlook remains neutral under present market conditions.
Bitcoin’s support zone is located at $18865 which is a 50% retracement from a 4-week high/low and at $19892 which is a 14-3 day raw stochastic at 70%.
The price of BTCUSD is now facing its classic resistance level of 21263 and Fibonacci resistance level of 21320 after which the path towards 22000 will get cleared.
In the last 24hrs BTCUSD has increased by 1.28% by 266.18$ and has a 24hr trading volume of USD 22.330 billion. We can see a decrease of 4.90% in the trading volume compared to yesterday, which appears to be normal.
The Week Ahead
Bitcoin’s price rocketed higher recently and moved to a 2-month high crossing the $21000 levels. We are now looking for the next upwards move towards the $22000 and $24000 levels.
The daily RSI is printing at 86.91 which indicates a very STRONG demand for bitcoin and the continuation of the bullish phase present in the markets in the short-term range.
We can see the formation of a bullish trend line from $17323 towards the $21324 level.
The price of BTCUSD is now facing its resistance zone located at $21466 which is a 13-week high and $22981 which is a 3-10 day MACD oscillator stalls.
The weekly outlook is projected at $23000 with a consolidation zone of $22000.
Technical Indicators:
The MACD (12,26): is at 689.90 indicating a BUY
The commodity channel index, CCI (14): is at 86.32 indicating a BUY
The rate of price change, ROC: is at 1.60 indicating a BUY
Bull/bear power (13): is at 593.30 indicating a BUY
VIEW FULL ANALYSIS VISIT - FXOpen Blog...
Disclaimer: This Forecast represents FXOpen Companies opinion only, it should not be construed as an offer, invitation or recommendation in respect to FXOpen Companies products and services or as Financial Advice.
EUR/USD Could Correct Lower While USD/JPY Starts Fresh Increase
EUR/USD is correcting lower and trading below 1.0820. USD/JPY could gain bullish momentum if there is a clear move above the 130.80 resistance.
Important Takeaways for EUR/USD and USD/JPY
[*] The Euro started a downside correction from the 1.0870 resistance zone.
[*] There was a break below a key bullish trend line with support near 1.0800 on the hourly chart of EUR/USD.
[*] USD/JPY is attempting a fresh increase above the 130.00 support zone.
[*] There was a break above a major bearish trend line with resistance near 129.20 on the hourly chart.
EUR/USD Technical Analysis
This past week, the Euro found support near the 1.0700 zone against the US Dollar. The EUR/USD pair started a steady upward move above the 1.0750 and 1.0800 resistance levels.
There was a clear increase above the 1.0820 resistance zone and the 50 hourly simple moving average. The pair even climbed towards the 1.0850 resistance zone. A high was formed near 1.0874 on FXOpen and the pair is now correcting gains.
EUR/USD Hourly Chart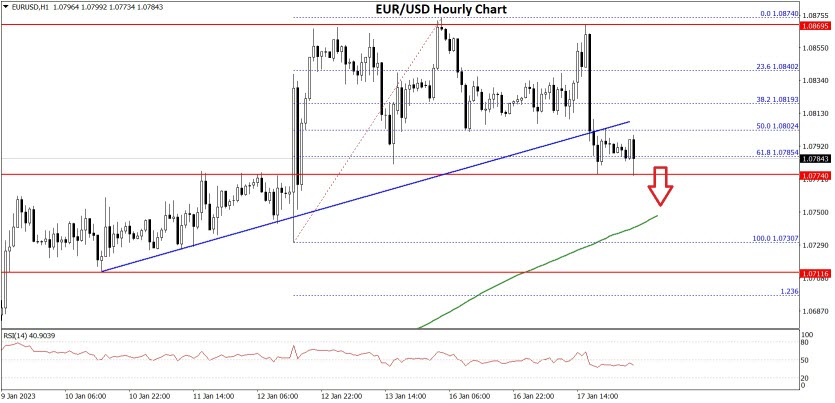
There was a move below the 1.0820 support zone. The bears pushed the pair below the 50% Fib retracement level of the upward move from the 1.0730 swing low to 1.0874 high.
Besides, there was a break below a key bullish trend line with support near 1.0800 on the hourly chart of EUR/USD. The pair is now showing bearish signs near 1.0785.
It is consolidating near the 61.8% Fib retracement level of the upward move from the 1.0730 swing low to 1.0874 high. An initial support on the downside is near the 1.0775 level. The first major support is near the 1.0750 level.
The main support sits near the 1.0720 zone, below which the pair could start a major decline. In the stated case, the pair might dive towards the 1.0650 support zone.
On the upside, an immediate resistance is near the 1.0820 level. The next major resistance is near the 1.0850 level. An upside break above 1.0850 could set the pace for another increase. In the stated case, the pair might visit 1.0920. Any more gains might send the pair towards 1.0980.
VIEW FULL ANALYSIS VISIT - FXOpen Blog...
Disclaimer: This Forecast represents FXOpen Companies opinion only, it should not be construed as an offer, invitation or recommendation in respect to FXOpen Companies products and services or as Financial Advice.
The Davos dampener: Markets stagnant on WEF discussions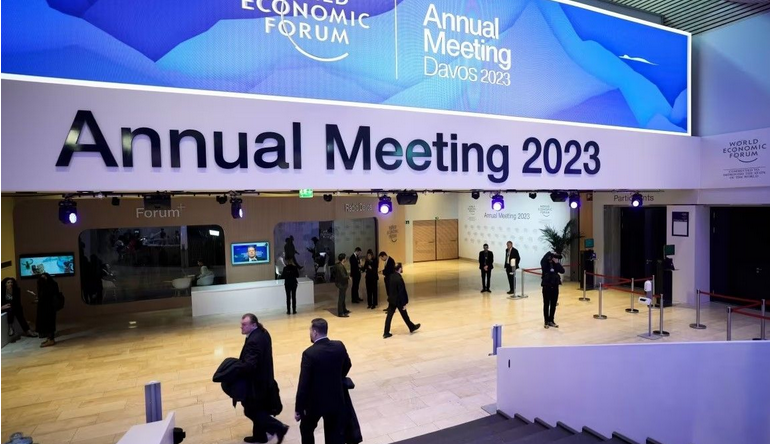
The annual World Economic Forum conference is well under way this week, and as can perhaps be expected, the debates taking place at the event, which is being held in its usual location of Davos, Switzerland, are having an effect on the global markets.
The World Economic Forum, often referred to by its acronym WEF, is well known to polarize opinions.
There are some who view it as a meeting of the global elite, who convene to discuss the planned agendas which in some cases are viewed as anti-business or anti-free market by dissenters, and there are those who consider it an important platform to address global matters on how the business world interacts with overall society and nature.
For this reason, the discussions taking place at the annual WEF conference are being reported widely by global media and having an effect on the markets.
It is common for high profile celebrities who attend the WEF annual conference to voice their opinions on fashionable issues such as the environment, or distribution of wealth, and on that subject, it was reported yesterday that approximately 200 members of the super-rich global elite, one of which was Disney heiress Abigail Disney, explained that they are calling on governments around the world to “tax us, the ultra rich, now” in order to help billions of people struggling with cost of living crisis.
This self-inflicted attempt to remove wealth from the coffers of some of the highest generators of income in the world is a way of clearly reinforcing a widely held opinion that the WEF conference is attended by many very wealthy individuals whose viewpoint favors removing their own and other peoples' wealth and distributing it, giving rise to a perception that it has socialist overtones.
On the agenda for discussion was the slow economic growth in western markets, and the ongoing geopolitical discourse between the Western nations and Russia and China.
On the subject of China's economy, it has grown just 3% in the past year, marking 2022 as the slowest growth for the Chinese economy in many years. Citi Group's chief executive Jane Fraser told a panel at the WEF annual meeting today that it is a positive step that China's economy is reopening.
The draconian lockdowns have paralized China's economy in the eyes of the outside world, however real economic data from inside China is very hard to obtain.
One interesting discussion, as reported today by the Financial Times, is that Gita Gopinath, deputy managing director of the IMF, signalled that the fund would upgrade its economic forecasts. Instead of predicting a “tougher” 2023, she now expected an “improvement” in the second half of the year and into 2024.
US business leaders hailed the Joe Biden administration’s Inflation Reduction Act — a $369bn bid to stimulate green investments in America’s economy.
Overall, whilst there has been a backdrop of harsh economic circumstances across many markets over the last year, the annual discussions at Davos often put the dampener on the markets until the conference is over. Let's hope it is business as usual after that.
VIEW FULL ANALYSIS VISIT - FXOpen Blog...
Disclaimer: This Forecast represents FXOpen Companies opinion only, it should not be construed as an offer, invitation or recommendation in respect to FXOpen Companies products and services or as Financial Advice.