Daily Market Analysis By FXOpen
ETHUSD and LTCUSD Technical Analysis – 19th JAN, 2023
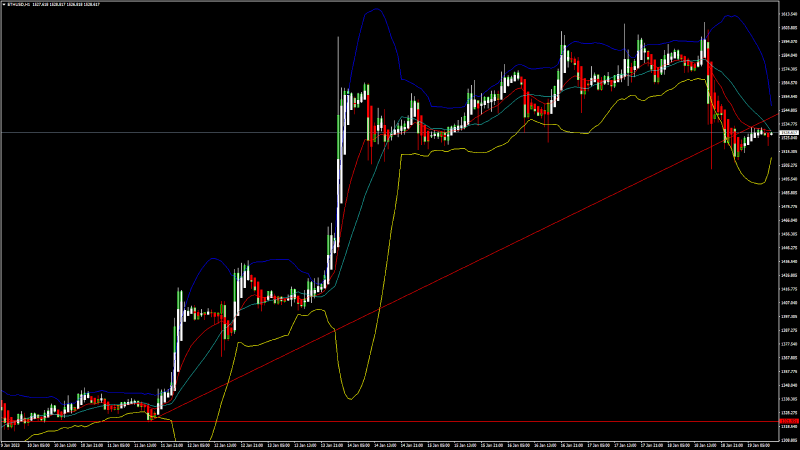
ETHUSD: Double Bottom Pattern Above $1321
Ethereum was unable to sustain its bearish momentum and after touching a low of 1321 on 11th Jan, the price started to correct upwards against the US dollar crossing the $1600 handle on 18th Jan.
The prices are ranging near horizontal support in the daily time frame indicating bullish trends.
We can clearly see a double bottom pattern above the $1321 handle which is a bullish pattern and signifies the end of a bearish phase and the start of a bullish phase in the markets.
ETH is now trading just below its pivot level of 1540 and moving in a mildly bullish channel. The price of ETHUSD is now testing its classic resistance level of 1575 and Fibonacci resistance level of 1639 after which the path towards 1700 will get cleared.
We have also seen the formation of a bullish harami pattern in the 15-minute time frame.
The relative strength index is at 72.46 indicating a STRONG demand for Ether and the continuation of the buying pressure in the markets.
Both the STOCH and average directional index are indicating an overbought market, which means that the prices are expected to decline in the short-term range.
Most of the technical indicators are giving a STRONG BUY market signal.
Most of the moving averages are giving a STRONG BUY signal at the current market levels of $1528.
ETH is now trading above both the 100 hourly simple and 100 hourly exponential moving averages.
[*] The short-term range appears to be mildly bullish
[*] ETH continues to remain above the $1500 level
[*] The average true range is indicating HIGH market volatility
Ether: Bullish Reversal Seen Above $1321
ETHUSD continues to trade higher against the US dollar and bitcoin. The price of Ethereum remains supported above the $1500 level and now we are testing the break of the $1600 handle.
We can see the formation of a bullish price crossover pattern with the adaptive moving average AMA20 in the daily time frame.
We have also detected a bullish Doji star pattern in the 1-hour time frame.
ETHUSD touched an intraday low of 1507 in the Asian Trading session and an intraday high of 1531 in the European trading session today.
The STOCHRSI is indicating a NEUTRAL level.
The key support levels to watch are $1432 which is a 38.2% Retracement from a 4-week high, and $1446 at which the price crosses 9-Day Moving Average.
ETH has decreased by 3.18% with a price change of 50.14$ in the past 24hrs and has a trading volume of 10.105 billion USD.
We can see an Increase 33.87% in the total trading volume in the last 24 hrs which appears to be normal.
The Week Ahead
ETH has already made a successful attempt at crossing the $1600 level and the next targets are located at $1700 and $1800 in the medium-term.
At present, the price is moving in a consolidation channel above the $1500 level.
We can see the formation of a bullish ascending channel from $1321 towards the $1542 level.
The immediate short-term outlook for Ether has turned mildly bullish, the medium-term outlook has turned bullish, and the long-term outlook for Ether is neutral under present market conditions.
The resistance zone is located at $1588 which is a pivot point 1st resistance point and at $1618 which is a 3-10 day MACD oscillator stalls.
The weekly outlook is projected at $1700 with a consolidation zone of $1650.
Technical Indicators:
The relative strength index, RSI (14): is at 72.46 indicating a BUY
The moving average convergence divergence, MACD (12,26): is at 79.85 indicating a BUY
The ultimate oscillator: is at 60.41 indicating a BUY
The rate of price change, ROC: is at 22.11 indicating a BUY
VIEW FULL ANALYSIS VISIT - FXOpen Blog...
Disclaimer: This Forecast represents FXOpen Companies opinion only, it should not be construed as an offer, invitation or recommendation in respect to FXOpen Companies products and services or as Financial Advice.
AUD/USD and NZD/USD At Risk of Additional Losses
AUD/USD declined below the 0.7000 and 0.6950 support levels. NZD/USD also declined towards 0.6365 and is currently attempting a recovery wave.
Important Takeaways for AUD/USD and NZD/USD
[*] The Aussie Dollar started a fresh decline from well above the 0.7000 level against the US Dollar.
[*] There was a break below a key bullish trend line with support near 0.6960 on the hourly chart of AUD/USD.
[*] NZD/USD declined heavily below the 0.6450 support zone and tested 0.6365.
[*] There was a break below a major bullish trend line with support near 0.6405 on the hourly chart of NZD/USD.
AUD/USD Technical Analysis
The Aussie Dollar started a fresh decline from the 0.7065 zone against the US Dollar. The AUD/USD pair remained in a bearish zone below the 0.7000 level.
There was a clear move below the 0.6950 support and the 50 hourly simple moving average. Besides, there was a break below a key bullish trend line with support near 0.6960 on the hourly chart of AUD/USD.
AUD/USD Hourly Chart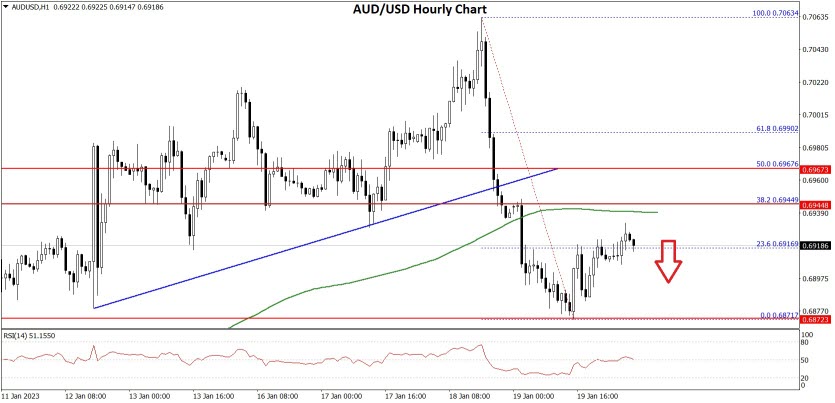
The pair traded as low as 0.6871 FXOpen and is currently correcting higher. It surpassed the 23.6% Fib retracement level of the downward move from the 0.7063 swing high to 0.6871 low.
On the upside, the AUD/USD pair is facing resistance near the 0.6940 level and the 50 hourly simple moving average. The next major resistance is near the 0.6970 level. It is near the 50% Fib retracement level of the downward move from the 0.7063 swing high to 0.6871 low.
A close above the 0.6970 level could start another steady increase in the near term. The next major resistance could be 0.7040.
On the downside, an initial support is near the 0.6890 level. The next support could be the 0.6870 level. If there is a downside break below the 0.6870 support, the pair could extend its decline towards the 0.6820 level. Any more losses might send the pair towards the 0.6750 support.
VIEW FULL ANALYSIS VISIT - FXOpen Blog...
Disclaimer: This Forecast represents FXOpen Companies opinion only, it should not be construed as an offer, invitation or recommendation in respect to FXOpen Companies products and services or as Financial Advice.
Watch FXOpen's January 16 - 20 Weekly Market Wrap Video
In this video, FXOpen UK COO Gary Thomson sums up the week’s happenings and discusses the most significant news reports.
[*] The Davos dampener: Markets stagnant on WEF discussions
[*] China stock market outlook
[*] The probability of a reversal of the dollar index is growing
[*] Crypto winter giving way to Crypto spring? Bitcoin suddenly wakes up
Watch our short and informative video, and stay updated with FXOpen.
FXOpen YouTube
Disclaimer: This forecast represents FXOpen Companies opinion only, it should not be construed as an offer, invitation or recommendation in respect to FXOpen Companies products and services or as financial advice.
GBP/USD Rallies Above 1.2400, USD/CAD Could Extend Losses
GBP/USD started a major increase and traded above 1.2400. USD/CAD is declining and might even trade below the 1.3350 support.
Important Takeaways for GBP/USD and USD/CAD
[*] The British Pound was able to move above the 1.2300 and 1.2350 resistance levels.
[*] There was a break above a key contracting triangle with resistance near 1.2380 on the hourly chart of GBP/USD.
[*] USD/CAD declined below the 1.3450 and 1.3400 support levels.
[*] It traded below a major bullish trend line with support near 1.3382 on the hourly chart.
GBP/USD Technical Analysis
After forming a base above the 1.2100, the British Pound started a steady increase against the US Dollar. GBP/USD gained pace for a move above the 1.2250 and 1.2300 resistance levels.
There was a move above the 1.2350 resistance and the 50 hourly simple moving average. The pair even moved above the 1.2400 level and traded as high as 1.2447 on FXOpen. During the increase, there was a break above a key contracting triangle with resistance near 1.2380 on the hourly chart of GBP/USD.
GBP/USD Hourly Chart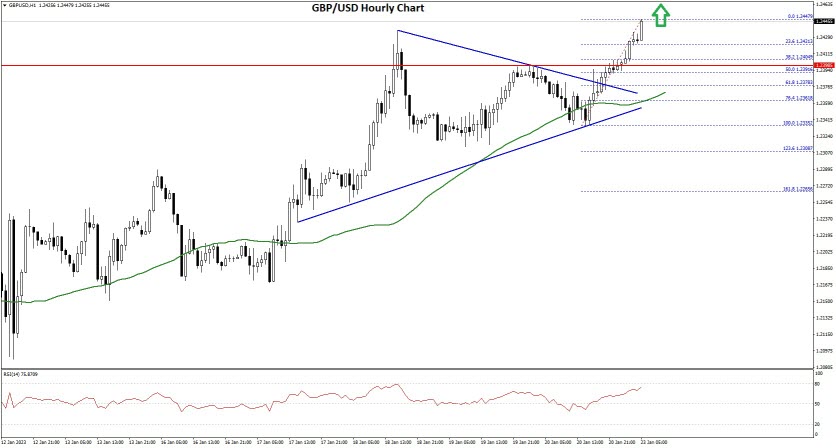
It is now correcting gains and trading near the 1.2440 level. However, it is trading well above 1.2350 and the 50 hourly simple moving average.
On the downside, an initial support is near the 1.2240 area. It is near the 23.6% Fib retracement level of the upward move from the 1.2335 swing low to 1.2447 high.
The next major support is near the 1.2400 level or the 50% Fib retracement level of the upward move from the 1.2335 swing low to 1.2447 high. If there is a break below 1.2390, the pair could extend its decline.
The next key support is near the 1.2320 level. Any more losses might call for a test of the 1.2250 support. An immediate resistance is near the 1.2450 level.
The next resistance is near the 1.2500 level. If there is an upside break above the 1.2500 zone, the pair could rise towards 1.2620. The next key resistance could be 1.2750.
VIEW FULL ANALYSIS VISIT - FXOpen Blog...
Disclaimer: This Forecast represents FXOpen Companies opinion only, it should not be construed as an offer, invitation or recommendation in respect to FXOpen Companies products and services or as Financial Advice.
Monday morning blues as EY forecast worse UK recession than expected
For almost two years, there have been constant looming thoughts that the United Kingdom's economy may face a long, drawn out recession.
During 2021, a time when the interest rates were rising at levels not seen in the past five decades across Europe and North America, there were reports casting a dark shadow over the future of the economy in many Western countries, often stating that it the circumstances at the time may lead to the worst recession in hundreds of years.
Lockdowns which caused low productivity among large companies whilst causing many smaller businesses to go out of business, a global supply chain disruption, and energy price increases which in some cases rocketed by several hundred percent due to geopolitical instability ae some of the reasons which have cast doubt in the minds of many, as costs for individuals and businesses soar whilst double-digit inflation causes earnings to depreciate.
The much-discussed forthcoming recession has not yet arrived, however. Yes, there is a severe cost of living crisis, and belts across Europe and the United Kingdom are very much tightened until their last buckle-hole, but still there is not an actual recession.
This has caused many analysts to consider the possibility that when it comes, it will be severe. Now, global consultancy Ernst & Young (EY) has begun to show its grave concern that a major recession which is worse than predicted, is on the horizon.
Reduced government support, higher taxes and an overall worsening outlook have all led the firm’s analysts to conclude that the next three years could be worse than they anticipated three months ago.
EY's prediction includes a forecast that the United Kingdom's gross domestic product could drop by 0.7% this year, but may increase again in the following years.
A year is a long time, however, and given the market volatility which has taken place over the past two years, looking at a very extensive recession which could last a whole year before any improvement is experienced is a big consideration.
It may be only one report, but EY is a large enough consultancy for the markets to take notice of. This morning the British Pound declined against the Euro and by 8.00am in the London trading session, it was trading in the low 1.14 range, a slight downturn after it rose to almost 1.15 late last week.
By contrast, the Pound remains stable against the US Dollar, therefore showing robustness despite the gloomy outlook.
It is worth noting that the FTSE 100 index is booming and has been doing so for a few weeks now, giving rise to the notion that despite the gloomy economic outlook, British blue chip stocks are extremely popular and the traditional companies making up the FTSE 100 index are performing strongly overall, compared to the tech stock carnage that has taken place on the NASDAQ exchange in the United States over the past few weeks.
It appears that whilst the US economy is doing overall better than the British economy, the big money is still sitting in the British low-tech and old school stocks whilst investors turn their back on volatile and depreciating US tech stocks.
VIEW FULL ANALYSIS VISIT - FXOpen Blog...
Disclaimer: This Forecast represents FXOpen Companies opinion only, it should not be construed as an offer, invitation or recommendation in respect to FXOpen Companies products and services or as Financial Advice.
Big Tech woes lead to layoffs, resulting in stock surge
Over recent months, Silicon Valley has been struggling to keep its position as an endlessly burgeoning region of massive profits and possibilities.
Technology stocks listed on NASDAQ have been decreasing in value, making the chart pattern for the NASDAQ Composite Index quite sobering reading.
Indeed, so severely have the tables turned on Silicon Valley's 'big tech' giants that European stock markets, with their legacy companies which have been in establishment for in some cases hundreds of years, have been outperforming the giants of the electronic revolution for many months.
Something had to give, and yesterday some of the most popularly traded companies in North America's big tech sector began to announce significant redundancies of staff.
Following last week's well publicized redundancies at Alphabet, Google's holding company, there have been more wounded tech firms following suit.
The layoffs at Google actually had a positive effect on stock values, and now other firms in a similar position are announcing their intention to go down a similar path.
Swedish music streaming service Spotify witnessed its shares rally yesteda as it announced its plan to cut hundreds of jobs to help rein in costs.
Shares of Alphabet rocketed at the end of last week, jumping 5% and adding more than $50 billion in market value, following the tech giant’s decision to lay off 12,000 workers on Friday, demonstrating that it had overspent and grown its business to rapidly since the 'e-commerce revolution' which took place in 2020 when many Western governments locked their populations down.
This appears to be a proven strategy, as those with a keen eye who have been monitoring the performance of Meta (previously known as Facebook) will have noticed that its shares have skyrocketed about 50% since the firm announced in November it would cut more than 11,000 jobs.
Silicon Valley was notoriously bloated, and many highly paid staff were allegedly sitting in vacation homes and refusing to come to the office during 2021. The tables are now turning, and the need to keep shareholders happy appears to be paramount at last.
VIEW FULL ANALYSIS VISIT - FXOpen Blog...
Disclaimer: This Forecast represents FXOpen Companies opinion only, it should not be construed as an offer, invitation or recommendation in respect to FXOpen Companies products and services or as Financial Advice.
BTCUSD and XRPUSD Technical Analysis – 24th JAN 2023
BTCUSD: Inverted Hammer Pattern Above $20671
Bitcoin continues its bullish momentum from last week and after touching a low of $20671on 19th Jan we can see a bull run which managed to push the prices of BTCUSD above the $23000 handle today in the early Asian trading session.
After touching a high of $23159 we can see that the prices are declining due to profit taking by the medium term investors.
The price of bitcoin is ranging near a new record high of 1 month.
We can clearly see an inverted hammer pattern above the $20671 handle which is a bullish reversal pattern because it signifies the end of a downtrend and a shift towards an uptrend.
Bitcoin touched an intraday high of 23159 in the Asian trading session and an intraday low of 22858 in the European trading session today.
Both the STOCH and Williams percent range are indicating overbought levels which means that in the immediate short term, a decline in the prices is expected.
The relative strength index is at 63.63 indicating a strong demand for bitcoin, and the continuation of the buying pressure in the markets.
Bitcoin is now moving above its 100 hourly exponential moving average and above its 200 hourly exponential moving average.
Most of the major technical indicators are giving a strong buy signal, which means that in the immediate short term, we are expecting targets of 23000 and 24500.
The average true range is indicating less market volatility with a strongly bullish momentum.
[*] Bitcoin: bullish continuation seen above $20671
[*] The STOCHRSI range is indicating oversold levels
[*] The price is now trading below its pivot level of $23066
[*] All of the moving averages are giving a STRONG BUY market signal
Bitcoin: Bullish Continuation Seen Above $20671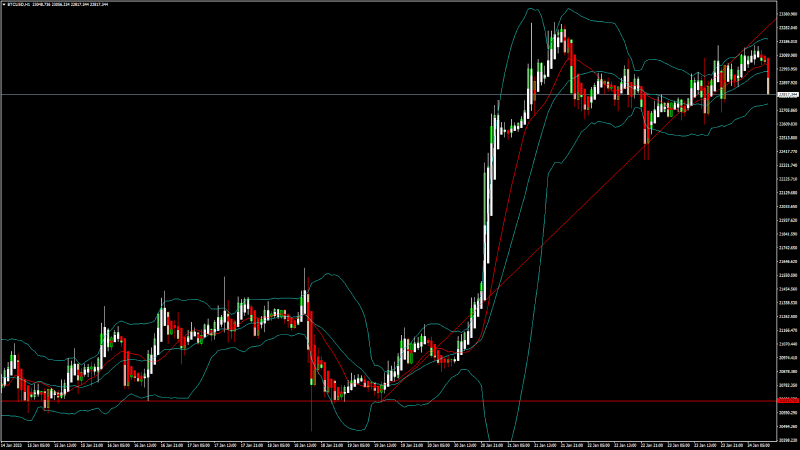
We can now see that the price of Bitcoin is moving in a correction phase after which the market consolidation will start above the $22500 handle.
The Aroon indicator is giving a bullish trend in the 1-hour time frame.
The momentum indicator is back over zero in the 30-minute time frame.
We can see the formation of the bullish harami cross pattern in the 15-minute time frame indicating bullish trends.
We have also detected a bullish price crossover pattern with the adaptive moving average AMA100 in the 15-minute time frame.
The immediate short-term outlook for bitcoin is strongly bullish, the medium-term outlook has turned bullish, and the long-term outlook remains neutral under present market conditions.
Bitcoin’s support zones are located at $21017 at which the price crosses 9-day moving average, and at $21976 which is a 14-3 day raw stochastic at 80%.
The price of BTCUSD is now facing its classic resistance level of 23200 and Fibonacci resistance level of 23288 after which the path towards 24000 will get cleared.
In the last 24hrs BTCUSD has increased by 0.47% by 107$ and has a 24hr trading volume of USD 27.839 billion. We can see an increase of 15.92% in the trading volume compared to yesterday, which is due to the heavy buying pressure seen in the global markets.
The Week Ahead
The price of bitcoin has already entered into a super bullish zone above the $22000 and further upsides are located at $24000 and $25000 in the medium-term.
Bitcoin’s resistance zone is located at $23309 which is a 13-week high and at $24778 which is a 3-10 day MACD oscillator stalls.
There is an ascending channel forming with the current support located at $19977 which is a 14-3 day raw stochastic at 50%.
The weekly outlook is projected at $24500 with a consolidation zone of $24000.
Technical Indicators:
The moving averages convergence divergence, MACD (12, 26): is at 359.30 indicating a BUY
The commodity channel index, CCI (14): is at 56.65 indicating a BUY
The relative strength index, RSI (14): is at 63.63 indicating a BUY
Bull/bear power (13): is at 594.12 indicating a BUY
VIEW FULL ANALYSIS VISIT - FXOpen Blog...
Disclaimer: This Forecast represents FXOpen Companies opinion only, it should not be construed as an offer, invitation or recommendation in respect to FXOpen Companies products and services or as Financial Advice.
EUR/USD Resumes Increase While USD/CHF Could Breakdown
EUR/USD gained pace above the 1.0850 resistance zone. USD/CHF is declining and remains at a risk of more losses below the 0.9220 support.
Important Takeaways for EUR/USD and USD/CHF
[*] The Euro started a fresh increase above the 1.0850 resistance against the US Dollar.
[*] There is a key bullish trend line forming with support near 1.0845 on the hourly chart of EUR/USD.
[*] USD/CHF started a fresh decline below the 0.9260 and 0.9250 support levels.
[*] There is a major bullish trend line forming with support near 0.9220 on the hourly chart.
EUR/USD Technical Analysis
In the past few days, the Euro started a steady increase from the 1.0780 zone against the US Dollar. The EUR/USD pair gained pace above the 1.0820 level to move into a bullish zone.
The pair even climbed above the 1.0850 resistance and settled above the 50 hourly simple moving average. It traded as high as 1.0927 on FXOpen and recently started a downside correction. There was a move below the 1.0880 level.
EUR/USD Hourly Chart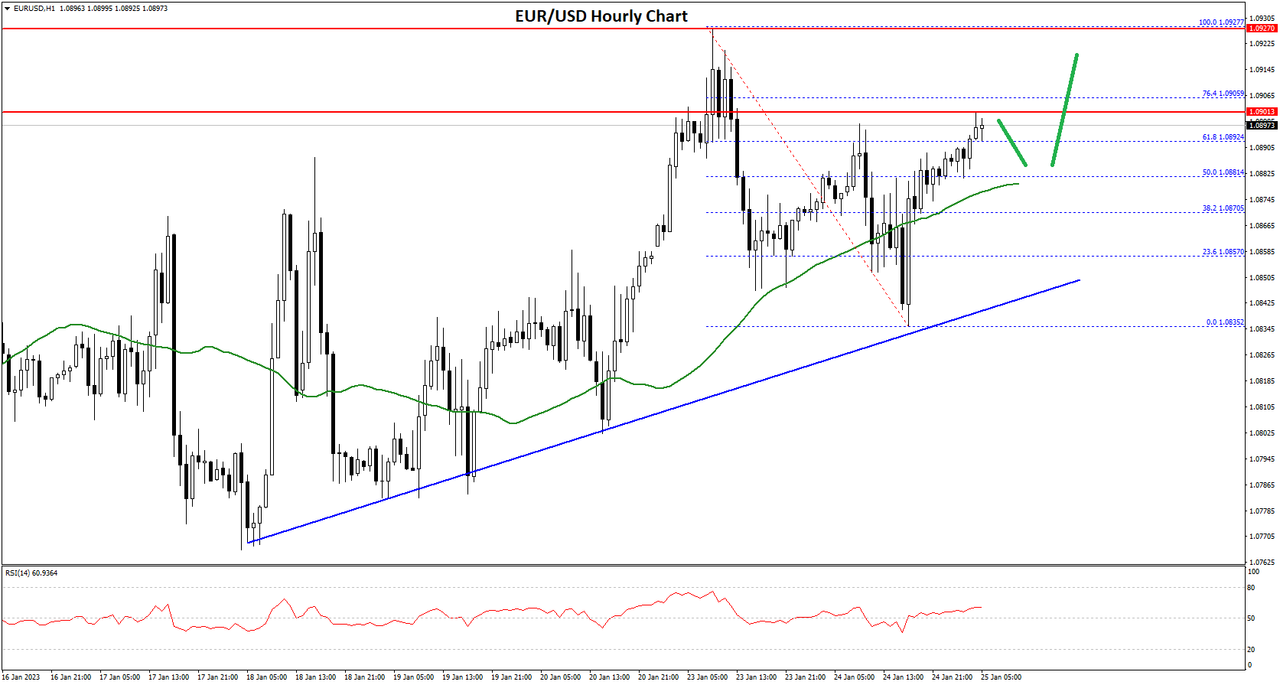
The pair traded as low as 1.0835 and is currently rising. There was a clear move above the 50% Fib retracement level of the recent decline from the 1.0927 swing high to 1.0835 low.
An immediate resistance is near the 1.0900 level. It is near the 76.4% Fib retracement level of the recent decline from the 1.0927 swing high to 1.0835 low. The next major resistance is near the 1.0920 level.
A clear move above the 1.0920 resistance zone could set the pace for a larger increase towards 1.0965. The next major resistance is near the 1.1000 zone. On the downside, an immediate support is near the 1.0880 level.
The next major support is near the 1.0850 level. There is also a key bullish trend line forming with support near 1.0845 on the hourly chart of EUR/USD. A downside break below the 1.0850 support could start another decline.
VIEW FULL ANALYSIS VISIT - FXOpen Blog...
Disclaimer: This Forecast represents FXOpen Companies opinion only, it should not be construed as an offer, invitation or recommendation in respect to FXOpen Companies products and services or as Financial Advice.
ETHUSD and LTCUSD Technical Analysis – 26th JAN, 2023
ETHUSD: Three Inside Up Pattern Above $1518
Ethereum was unable to sustain its bearish momentum and after touching a low of 1518 on 25th Jan, the price started to correct upwards against the US dollar crossing the $1600 handle today in the European trading session.
We have seen a bullish opening of the markets this week.
We can clearly see a three inside up pattern above the $1518 handle which is a bullish pattern and signifies the end of a bearish phase and the start of a bullish phase in the markets.
ETH is now trading just below its pivot level of 1607 and moving into a mildly bullish channel. The price of ETHUSD is now testing its classic resistance level of 1610 and Fibonacci resistance level of 1613 after which the path towards 1700 will get cleared.
The relative strength index is at 56.75 indicating a STRONG demand for Ether and the continuation of the bullish phase in the markets.
The price of Ethereum is ranging near the horizontal support in the 1-hour time frame indicating bullish trends.
Both the STOCH and CCI are indicating a neutral market, which means that the prices are expected to remain in a consolidation phase.
Most of the technical indicators are giving a BUY market signal.
Most of the moving averages are giving a BUY signal and we are now looking at the levels of $1650 to $1700 in the short-term range.
ETH is now trading above both the 100 & 200 hourly simple and exponential moving averages.
[*] Ether: bullish reversal seen above the $1518 mark
[*] The short-term range appears to be mildly bullish
[*] ETH continues to remain above the $1600 level
[*] The average true range is indicating LESS market volatility
Ether: Bullish Reversal Seen Above $1518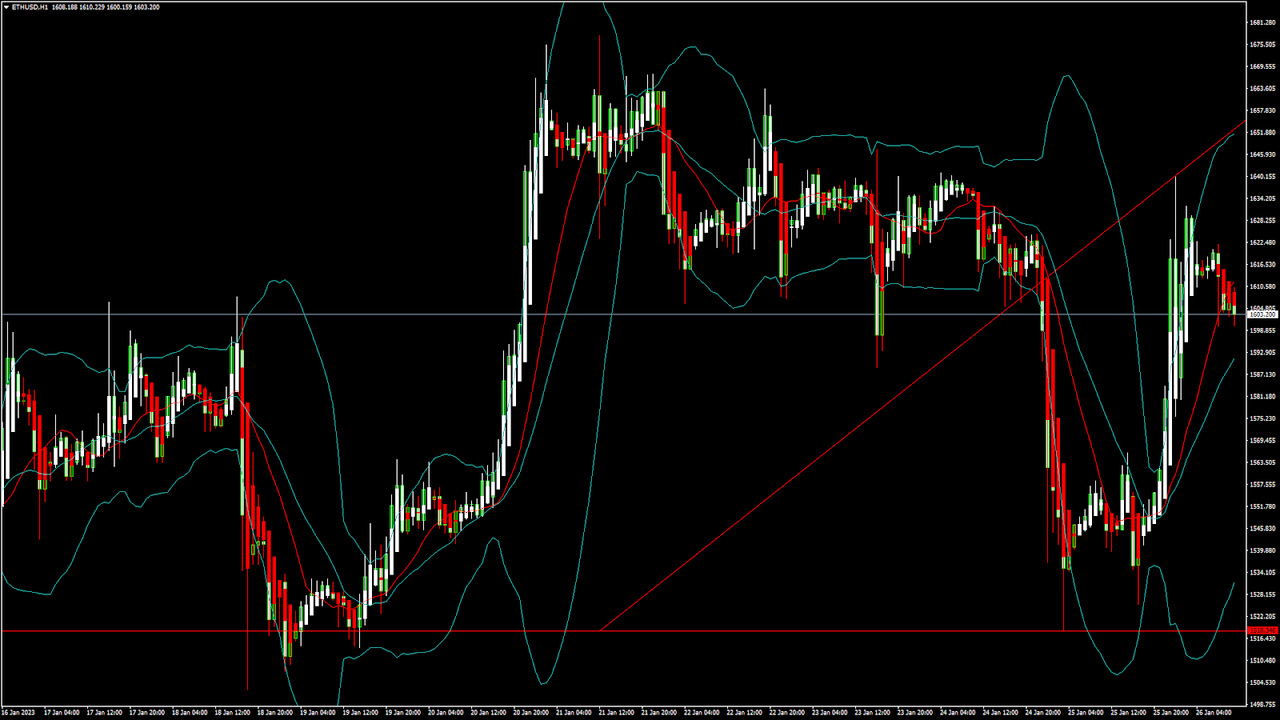
ETHUSD is now moving into a mildly bullish channel with the price trading above the $1600 handle in the European trading session today.
ETH touched an intraday high of 1625 in the Asian trading session and an intraday low of 1600 in the European trading session today.
We can see the formation of a bullish price crossover pattern with adaptive moving average AMA20 in the 30-minute time frame.
The Aroon indicator is giving a bullish trend in the 4-hour time frame.
We have also detected the formation of moving average bullish crossovers: MA50 & MA100 in the daily time frame.
Ethereum’s price is rising sharply against the US dollar and nitcoin and is now eyeing to cross the $1700 level soon.
The daily RSI is printing at 65.97 indicating a STRONG demand for Ether in the medium-term range.
The key support levels to watch are $1489 which is a 38.2% Retracement from a 4-week high, and $1536 which is a 3-10-16 day MACD moving average stalls.
ETH has increased by 3.98% with a price change of 61.50$ in the past 24hrs and has a trading volume of 10.232 billion USD.
We can see an increase of 10.64% in the total trading volume in the last 24 hrs which appears to be normal.
The Week Ahead
ETH price continues to remain in a bullish zone against the US dollar and bitcoin. ETHUSD is expected to move higher towards the $11650 and $1700 levels this week.
On the upside we are now looking at the immediate targets of 1677 which is a 13-week high, and $1685 which is a pivot point 2nd level resistance.
The immediate short-term outlook for Ether has turned strongly bullish, the medium-term outlook has turned bullish, and the long-term outlook for Ether is neutral in present market conditions.
The price of ETHUSD will need to remain above the important support level of $1588 which is a pivot point.
The weekly outlook is projected at $1700 with a consolidation zone of $1650.
Technical Indicators:
The average directional index, ADX (14): is at 45.27 indicating a BUY
The rate of price change: is at 2.735 indicating a BUY
Bull/bear power (13): is at 7.52 indicating a BUY
The Williams percent range : is at -44.41 indicating a BUY
VIEW FULL ANALYSIS VISIT - FXOpen Blog...
Disclaimer: This Forecast represents FXOpen Companies opinion only, it should not be construed as an offer, invitation or recommendation in respect to FXOpen Companies products and services or as Financial Advice.
Gold Price Could Dip While Crude Oil Price Trades In Range
Gold price is struggling to stay above the $1,925 support. Crude oil price is facing a strong resistance near the $82 zone.
Important Takeaways for Gold and Oil
[*] Gold price started a strong increase and tested $1,950 against the US Dollar.
[*] There is a key bullish trend line forming with support near $1,925 on the hourly chart of gold.
[*] Crude oil price started a fresh increase from the $79.50 support zone.
[*] There is a major bullish trend line forming with support near $80.40 on the hourly chart of XTI/USD.
Gold Price Technical Analysis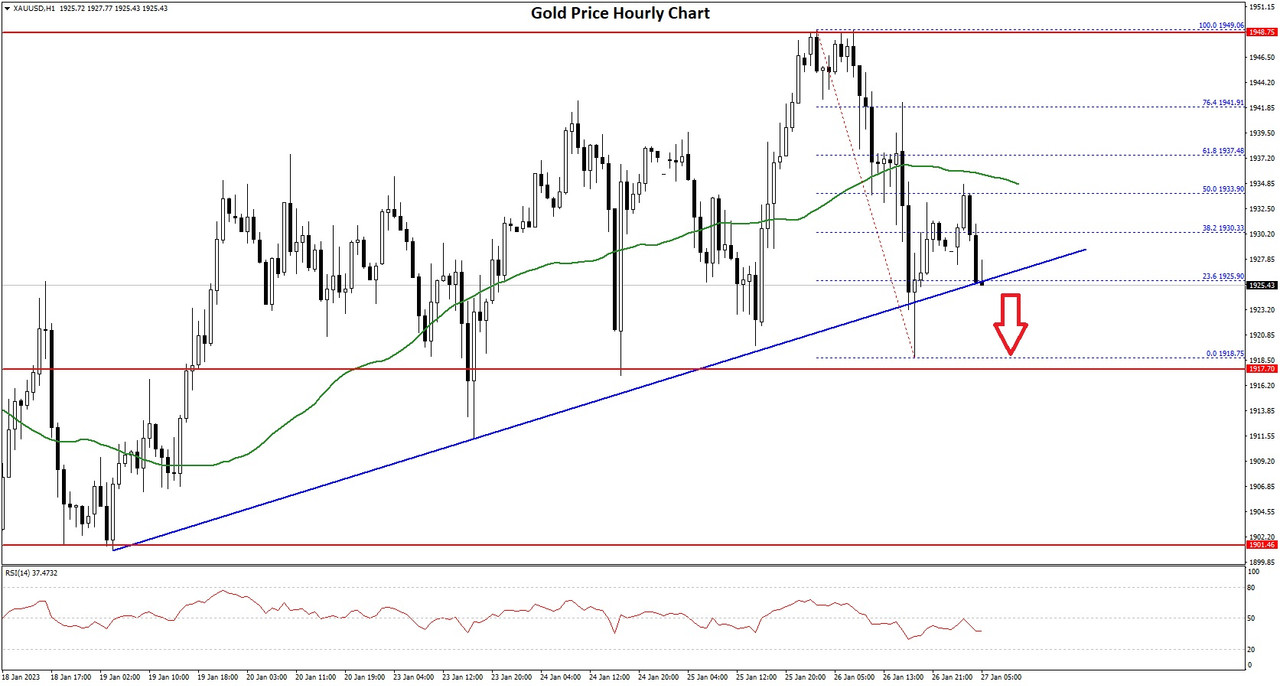
Gold price formed a base above the $1,900 level against the US Dollar. The price started a strong increase above the $1,915 and $1,920 resistance levels to move into a positive zone.
The bulls even pumped the price above the $1,940 and the 50 hourly simple moving average. The price even tested the $1,950 zone. A high is formed near $1,949 on FXOpen and the price is now correcting gains.
Gold Price Hourly Chart
There was a move below the $1,940 level and the 50 hourly simple moving average. The price even dipped below the $1,920 level before the bulls appeared.
Recently, there was a recovery wave above the 23.6% Fib retracement level of the downward move from the $1,949 swing high to $1,918 low. However, the bears are active below the $1,935 level and the 50 hourly simple moving average.
The price failed to clear the 50% Fib retracement level of the downward move from the $1,949 swing high to $1,918 low. It is now moving lower below $1,930.
An immediate support on the downside is near the $1,925 level. There is also a key bullish trend line forming with support near $1,925 on the hourly chart of gold. The next major support is near the $1,915 level, below which there is a risk of a larger decline. In the stated case, the price could decline sharply towards the $1,900 support zone.
On the upside, the first major resistance is near the $1,930 level. The next key hurdle is near the $1,935 level, above which it could even test $1,950. A clear upside break above the $1,950 resistance could send the price towards $1,965.
VIEW FULL ANALYSIS VISIT - FXOpen Blog...
Disclaimer: This Forecast represents FXOpen Companies opinion only, it should not be construed as an offer, invitation or recommendation in respect to FXOpen Companies products and services or as Financial Advice.