Daily Market Analysis By FXOpen
AUD/USD and NZD/USD Eye Steady Increase: Here’s Why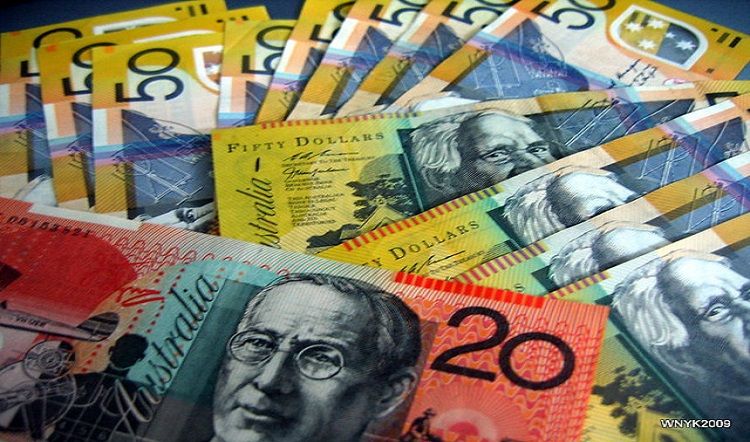
AUD/USD is moving higher and might climb further higher above 0.6800. NZD/USD is also rising and might surge above the 0.6440 resistance zone.
Important Takeaways for AUD/USD and NZD/USD
[*] The Aussie Dollar started a fresh increase above the 0.6720 and 0.6740 levels against the US Dollar.
[*] There is a key bullish trend line forming with support near 0.6780 on the hourly chart of AUD/USD.
[*] NZD/USD is showing a lot of bullish signs above the 0.6380 support zone.
[*] There was a break above a major bearish trend line with resistance near 0.6360 on the hourly chart of NZD/USD.
AUD/USD Technical Analysis
The Aussie Dollar formed a base above the 0.6660 level and started a fresh increase against the US Dollar. The AUD/USD pair gained pace above the 0.6700 level to move into a positive zone.
There was a clear move above the 0.6720 level and the 50 hourly simple moving average. The bulls pushed the pair above the 50% Fib retracement level of the downward move from the 0.6850 swing high to 0.6668 low.
AUD/USD Hourly Chart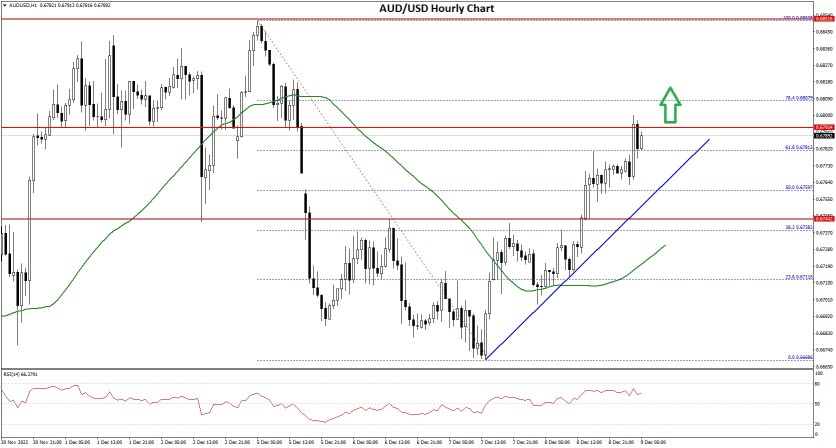
The pair even climbed above the 0.6740 level and traded as high as 0.6778. It is now consolidating gains near the 0.6800 resistance zone.
On the upside, the AUD/USD pair is facing resistance near the 0.6810 level. It is near the 76.4% Fib retracement level of the downward move from the 0.6850 swing high to 0.6668 low. The next major resistance is near the 0.6850 level.
A close above the 0.6850 level could start another steady increase in the near term. The next major resistance could be 0.6920.
On the downside, an initial support is near the 0.6780 level. There is also a key bullish trend line forming with support near 0.6780 on the hourly chart of AUD/USD. The next support could be the 0.6740 level. If there is a downside break below the 0.6740 support, the pair could extend its decline towards the 0.6660 level.
VIEW FULL ANALYSIS VISIT - FXOpen Blog...
Disclaimer: This forecast represents FXOpen Companies opinion only, it should not be construed as an offer, invitation or recommendation in respect to FXOpen Companies products and services or as financial advice.
Watch FXOpen's December 5 - 9 Weekly Market Wrap Video
In this video, FXOpen UK COO Gary Thomson sums up the week’s happenings and discusses the most significant news reports.
[*] Brent Crude Oil is on the up as G7 price cap deals blow
[*] UK's recession bites again as pound dives to 1.22 against US Dollar
[*] The Pentagon signs a $9 billion contract
[*] S&P500 closes lower for fourth day as recession fears bite
Watch our short and informative video and stay updated with FXOpen.
FXOpen YouTube
Disclaimer: This forecast represents FXOpen Companies opinion only, it should not be construed as an offer, invitation or recommendation in respect to FXOpen Companies products and services or as financial advice.
GBP/USD Reaches Key Support, USD/CAD Gains Bullish Momentum
GBP/USD started a downside correction below 1.2250. USD/CAD is rising and might gain pace above the 1.3700 resistance zone.
Important Takeaways for GBP/USD and USD/CAD
[*] The British Pound was able to move above the 1.2200 and 1.2250 resistance levels.
[*] There is a key bullish trend line forming with support near 1.2220 on the hourly chart of GBP/USD.
[*] USD/CAD climbed higher above the 1.3600 and 1.3620 resistance levels.
[*] It cleared a major bearish trend line with resistance near 1.3660 on the hourly chart.
GBP/USD Technical Analysis
After forming a base above the 1.2100, the British Pound started a steady increase against the US Dollar. GBP/USD gained pace for a move above the 1.2150 and 1.2200 resistance levels.
There was a move above the 1.2250 resistance and the 50 hourly simple moving average. The pair even moved above the 1.2300 level and traded as high as 1.2322. It is now correcting gains and trading below the 1.2300 level.
GBP/USD Hourly Chart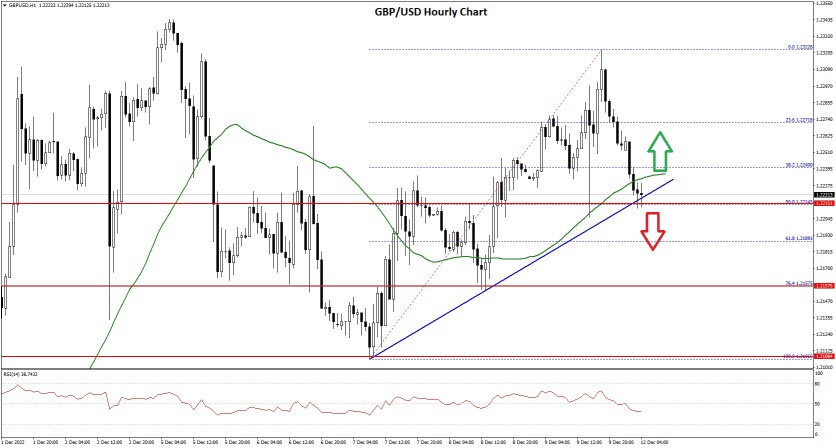
Recently, there was a move below the 1.2280 and 1.2250 support levels. The pair declined below the 38.2% Fib retracement level of the upward move from the 1.2105 swing low to 1.2322 high.
It is now trading below the 1.2240 level and the 50 hourly simple moving average. On the downside, an initial support is near the 1.2220 area. It is near the 50% Fib retracement level of the upward move from the 1.2105 swing low to 1.2322 high.
There is also a key bullish trend line forming with support near 1.2220 on the hourly chart of GBP/USD. The next major support is near the 1.2190 level. If there is a break below 1.2190, the pair could extend its decline. The next key support is near the 1.2120 level. Any more losses might call for a test of the 1.2100 support.
An immediate resistance is near the 1.2250 level. The next resistance is near the 1.2280 level. The main resistance is near the 1.2325 level. If there is an upside break above the 1.2325 zone, the pair could rise towards 1.2400. The next key resistance could be 1.2500.
VIEW FULL ANALYSIS VISIT - FXOpen Blog...
Disclaimer: This forecast represents FXOpen Companies opinion only, it should not be construed as an offer, invitation or recommendation in respect to FXOpen Companies products and services or as financial advice.
Sudden gold price hike attracts speculative attention
Gold prices over the past few weeks have been rising sharply.
In early November, the price of gold was at its lowest point in over 6 months, languishing at $1,628 per ounce, however the sudden rise in value has culminated in gold prices being at their highest since the summer, arriving at over $1,796 per ounce on today's market.
As it stands, the price of gold is aiming to recapture a five-month high at around $1,800.00 as the risk-on profile is regaining traction.
Volatility in a market which is usually not so volatile due to gold being regarded as a physical store of value and therefore the preserve of conservative investors who wish to keep an investment in the precious metal as a safety net against any central bank policy affecting the currency markets, adverse national economic conditions or corporate decisions affecting stock prices when investing in listed companies.
The very dynamic that is currently taking place in that gold is fluctuating significantly in value has led to some attention from analysts and investors, some of which have called it a 'bull run', and others who are making wild speculations that gold could increase dramatically in value to around $3000 per ounce in 2023, a figure which seems outlandish and stratospheric.
There are also a number of conservative views, some of which are that although gold finished last week's trading at almost $1,800 an ounce, there is a high chance for a move lower as the Federal Reserve can still surprise on the hawkish side.
The Federal Reserve Bank is likely to announce another interest rate rise on Wednesday, with markets looking for a slower tightening pace of 50 base points versus 75 base points, and when looking at precious metals being traded on commodities exchanges rather than on an over the counter basis, things are already looking to slow a bit.
On this basis, gold is trading essentially flat during the course of last week, with February Comex gold futures remaining very level at $1,815 an ounce.
It is all very well taking the opinion that people may invest in gold should a recession set in, in order to safeguard their capital against possible economic woes in the currency and stock markets, but in the case in which interest rates rise and recessions bite, there is a tendency toward maintaining cash to pay for increased costs of living during a time when the means of most are stretched, meaning that many people do not have the extra capital to invest and will concentrate on everyday expenses.
VIEW FULL ANALYSIS VISIT - FXOpen Blog...
Disclaimer: This forecast represents FXOpen Companies opinion only, it should not be construed as an offer, invitation or recommendation in respect to FXOpen Companies products and services or as financial advice.
Crypto winter continues big freeze with values as frosty as weather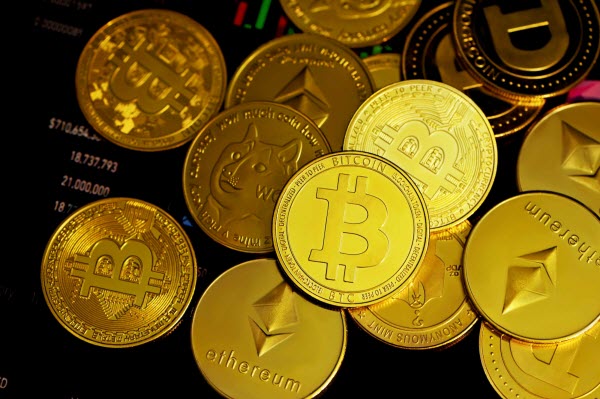
The weather across parts of Northern Europe and the United Kingdom this week has suddenly turned, and even areas which are ordinarily not associated with snowfall have been covered in a white blanket for a few days.
Travel disruptions at airports have taken place, and a minus figure has been displayed on temperature gauges since Monday.
Finally the real winter weather is here, however the term 'crypto winter' has been in place for quite some time, despite the unusually warm weather during October and November, during which it was not uncommon to see people wearing summer clothes and sitting outside cafes.
The only real sign of winter in the unusually long and pleasant summer conditions was the use in the financial markets sector of the term 'crypto winter', which does not refer to seasons or weather conditions, but instead the 'frozen' values of cryptocurrencies in which prices contract and remain low for an extended period.
Well, now there is a seasonal winter and a crypto winter at the same time.
Bitcoin values once again took a tumble during the early hours of this morning, and by 7.20am UK time, had reached a low point of $17,125 per Bitcoin against the US Dollar.
Over the two hours which ensued, Bitcoin made some headway, increasing to $17,177 but that is still 0.21% down overall during today compared to yesterday.
Looking over the five day moving average, however, the dip in value appears to have been present for a longer period of time. On December 12, values plunged and did not recover until the middle of the morning on December 13, and a 0.44% reduction in value is displayed when charting Bitcoin's performance over the past five days.
Although we certainly still are well ensconced in the Crypto Winter scenario, things are a little brighter than they were last month however. The sun may have been shining across Europe but Bitcoin values were even lower than they are now.
Bitcoin has actually risen by over 5% in value over the course of the past 30 days, so the snow may have fallen and the winter clothes been suddenly put to use, but is this the beginning of the big thaw for the Crypto Winter?
VIEW FULL ANALYSIS VISIT - FXOpen Blog...
Disclaimer: This forecast represents FXOpen Companies opinion only, it should not be construed as an offer, invitation or recommendation in respect to FXOpen Companies products and services or as financial advice.
EUR/USD Gains Bullish Momentum While USD/CHF Dips Further
EUR/USD gained pace above the 1.0600 resistance zone. USD/CHF is declining and remains at a risk of more losses below the 0.9240 support.
Important Takeaways for EUR/USD and USD/CHF
[*] The Euro started a fresh increase above the 1.0550 resistance against the US Dollar.
[*] There was a break above a major contracting triangle with resistance near 1.0565 on the hourly chart of EUR/USD.
[*] USD/CHF started a fresh decline below the 0.9350 and 0.9315 support levels.
[*] There is a key bearish trend line forming with resistance near 0.9360 on the hourly chart.
EUR/USD Technical Analysis
This week, the Euro started a steady increase from the 1.0450 zone against the US Dollar. The EUR/USD pair gained pace above the 1.0500 level to move into a bullish zone.
The pair even climbed above the 1.0600 resistance and settled above the 50 hourly simple moving average. During the increase, there was a break above a major contracting triangle with resistance near 1.0565 on the hourly chart of EUR/USD.
EUR/USD Hourly Chart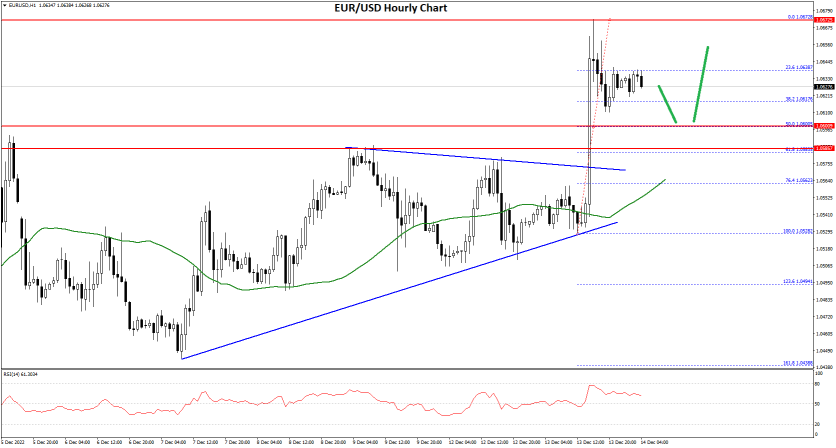
It traded as high as 1.0672 on FXOpen and recently started a downside correction. There was a move below the 1.0650 level. The pair tested the 38.2% Fib retracement level of the upward move from the 1.0528 swing low to 1.0672 high.
On the downside, an immediate support is near the 1.0600 level. The 50% Fib retracement level of the upward move from the 1.0528 swing low to 1.0672 high is also near the 1.0600 zone.
The next major support is near the 1.0565 level. A downside break below the 1.0565 support could start another decline.
An immediate resistance is near the 1.0640 level. The next major resistance is near the 1.0675 level. A clear move above the 1.0675 resistance zone could set the pace for a larger increase towards 1.0750. The next major resistance is near the 1.0800 zone.
VIEW FULL ANALYSIS VISIT - FXOpen Blog...
Disclaimer: This forecast represents FXOpen Companies opinion only, it should not be construed as an offer, invitation or recommendation in respect to FXOpen Companies products and services or as financial advice.
GBP makes remarkable gains as UK inflation slows, but it's still 10.7%
It is quite fascinating how perceived good news tends to have a positive effect on the value of a sovereign currency.
The British Pound, which spent most of the tail end of this summer plummeting into the depths of obscurity against the surprisingly strong US dollar, at one point reaching as low as 1.18 which was its lowest point in over 40 years, has been rising dramatically in value.
Today, the Pound is up again, continuing its comeback which began taking place just two weeks ago and is now trading at 1.24 against the US Dollar.
Partly this has come about due to a slight weakening in the value of the US Dollar, which spent over a year holding its strength against all other major currencies despite the US economy suffering similarly high levels of inflation to Europe and the United Kingdom, at one point reaching 10.8% and being heralded as the highest inflation since the early 1970s.
Here's the unusual thing.
At the beginning of December, inflation in the United States began to rapidly decrease, and by two weeks ago stood at 7.7% which is still high, but a massive change for the better compared to the 10% it was at during the early summer of 2022.
Rather than surging even higher, the US Dollar actually decreased in value as US inflation lowered. Why would such a thing happen? Surely lower inflation, especially to that extent, would indicate a rapidly strengthening national economy? Yes, it does, however the need to do business with other nations whose inflation levels remain at over 10% meant that the US firms would have to pay more continually for services, products and wages for their subsidies in other regions as inflation in those regions continues to be high.
This would mean higher costs for US companies, so a conservative view was taken.
By the same bizarre token, the British Pound is on its way up as the US Dollar decreases, despite the British economy floundering and the inflation rate having gone up again today to a lofty 10.8%.
As the new year approaches, anticipation of interest rates reaching 5 to 6% is on the mind of many investors, and if that happens, it will create a huge increase in monthly payments on mortgages and unsecured borrowing for citizens of the United Kingdom, and may well slow consumer spending as priority bills and loan commitments take priority.
This inverse rationale with regard to currency value increases despite high inflation is an interesting dynamic and one to follow.
VIEW FULL ANALYSIS VISIT - FXOpen Blog...
Disclaimer: This forecast represents FXOpen Companies opinion only, it should not be construed as an offer, invitation or recommendation in respect to FXOpen Companies products and services or as financial advice.
ETHUSD and LTCUSD Technical Analysis – 15th DEC, 2022
ETHUSD: Three White Soldiers Pattern Above $1222
Ethereum was unable to sustain its bearish momentum and after touching a low of 1222 on 08th Dec, the price started to correct upwards against the US dollar moving into a consolidation channel above the $1250 handle today in the European trading session.
We can see the formation of a bullish doji star pattern in the 1-hour time frame indicating bullish trends.
The commodity channel index indicator is giving a bullish divergence signal in the 1-hour time frame.
We can clearly see a three white soldiers pattern above the $1222 handle which is a bullish pattern and signifies the end of a bearish phase and the start of a bullish phase in the markets.
ETH is now trading just above its pivot level of 1286 and is moving into a consolidation channel. The price of ETHUSD is now testing its classic resistance level of 1287 and Fibonacci resistance level of 1288 after which the path towards 1300 will get cleared.
The relative strength index is at 48 indicating a NEUTRAL demand for Ether and the continuation of the consolidation phase in the markets.
The resistance of the channel is broken on the daily time frame.
The STOCHRSI is indicating an OVERBOUGHT level, which means that the prices are expected to decline in the short-term range.
Some of the technical indicators are giving a BUY market signal.
Most of the moving averages are giving a NEUTRAL signal due to the market consolidation seen below the $1300 handle.
ETH is now trading below both the 100 hourly simple and 200 hourly exponential moving averages.
[*] The short-term range appears to be mildly bullish
[*] ETH continues to remain above the $1250 level
[*] The average true range is indicating LESS market volatility
Ether: Bullish Reversal Seen Above $1222
ETHUSD is now moving into a consolidation/correction channel with the price trading below the $1300 handle in the European trading session today.
The prices of Ethereum are ranging near the support of the channel indicating bullish trends.
The MACD indicator is now giving a bullish divergence signal in the 30-minute time frame.
The price of Ethereum broke the $1300 level and then we can see some decline due to short selling of Ether which caused the dip below the $1300 level.
ETHUSD touched an intraday high of 1314 and an intraday low of 1281 in the Asian trading session today.
We have seen a bullish opening in the markets this week.
The daily RSI is printing at 51 indicating a neutral demand for Ether in the long-term range.
The key support levels to watch are $1210 which is a 14-3 day raw stochastic at 30%, and $1244 which is a 38.2% retracement from 4 Week High.
ETH has decreased by 2.50% with a price change of 33.04$ in the past 24hrs and has a trading volume of 8.409 billion USD.
We can see an increase of 0.58% in the total trading volume in the last 24 hrs which appears to be normal.
The Week Ahead
The price of ETH has now entered into a consolidation/correction zone, and after this we are expecting fresh upside waves crossing the $1300 and $1400 levels.
ETHUSD continues to gain bullish traction from a weekly time frame from a 4-hour time frame with the bottom support located at $1075 touched on 22nd Nov.
The immediate short-term outlook for Ether has turned mildly bullish, the medium-term outlook has turned neutral, and the long-term outlook for Ether is neutral in present market conditions.
The price of ETHUSD will need to remain above the important support level of $1243 at which the price crosses the 18-day moving average.
The resistance zone is located at $1291 at which the price crosses 9-day moving average stalls.
The weekly outlook is projected at $1350 with a consolidation zone of $1300.
Technical Indicators:
The Williams percent range: is at -24.78 indicating a BUY
The commodity channel index (14): is at 62.01 indicating a BUY
High/Lows (14): is at 0.3436 indicating a BUY
Bull/Bear power (13): is at 0.6240 indicating a BUY
VIEW FULL ANALYSIS VISIT - FXOpen Blog...
Disclaimer: This forecast represents FXOpen Companies opinion only, it should not be construed as an offer, invitation or recommendation in respect to FXOpen Companies products and services or as financial advice.
Gold Price Consolidates Losses, Crude Oil Price Could Correct Gains
Gold price started a fresh decline below the $1,785 support zone. Crude oil price struggling near $78 and might correct gains in the near term.
Important Takeaways for Gold and Oil
[*] Gold price faced resistance near $1,825 and corrected lower against the US Dollar.
[*] There was a break below a key bullish trend line with support near $1,798 on the hourly chart of gold.
[*] Crude oil price gained bullish momentum above the $72.00 resistance zone.
[*] There is a major bullish trend line forming with support near $76.10 on the hourly chart of XTI/USD.
Gold Price Technical Analysis
Gold price traded high above the $1,810 resistance zone against the US Dollar. The price even cleared the $1,820 level, but the bears were active near the $1,825 zone.
A high was formed near $1,824 and the price started a fresh decline. There was a clear move below the $1,810 and $1,800 support levels. Besides, there was a break below a key bullish trend line with support near $1,798 on the hourly chart of gold.
Gold Price Hourly Chart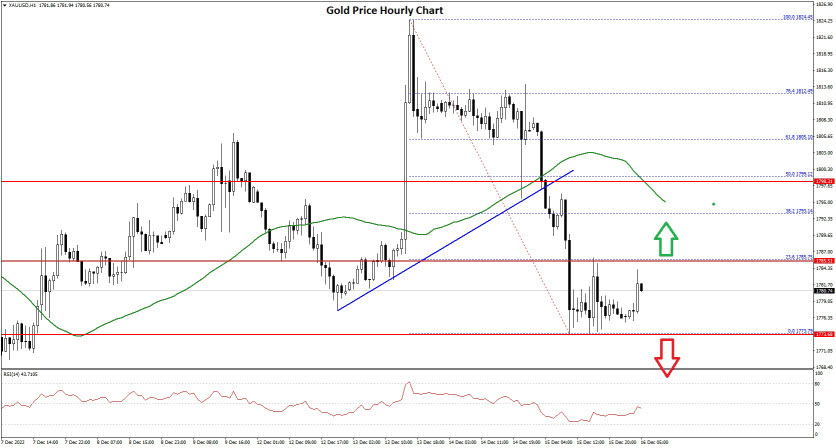
The price settled below the $1,785 level and the 50 hourly simple moving average. It traded as low as $1,773 on FXOpen and is currently consolidating losses. On the upside, the first major resistance is near the $1,785 level.
The 23.6% Fib retracement level of the downward move from the $1,824 swing high to $1,773 swing low is also near the $1,785 level. The main resistance is now forming near the $1,800 level and the 50 hourly simple moving average.
The 50% Fib retracement level of the downward move from the $1,824 swing high to $1,773 swing low is also near the $1,800 level, above which it could even test $1,820. A clear upside break above the $1,820 resistance could send the price towards $1,840.
An immediate support on the downside is near the $1,772 level. The next major support is near the $1,760 level, below which there is a risk of a larger decline. In the stated case, the price could decline sharply towards the $1,750 support zone.
VIEW FULL ANALYSIS VISIT - FXOpen Blog...
Disclaimer: This forecast represents FXOpen Companies opinion only, it should not be construed as an offer, invitation or recommendation in respect to FXOpen Companies products and services or as financial advice.
Watch FXOpen's December 12 - 16 Weekly Market Wrap Video
In this video, FXOpen UK COO Gary Thomson sums up the week’s happenings and discusses the most significant news reports.
[*] Sudden gold price hike attracts speculative attention
[*] What the future holds for the Fed
[*] EUR/USD gains bullish momentum while USD/CHF dips further
[*] GBP makes remarkable gains as UK inflation slows, but it's still 10.7%
Watch our short and informative video and stay updated with FXOpen.
FXOpen YouTube
Disclaimer: This forecast represents FXOpen Companies opinion only, it should not be construed as an offer, invitation or recommendation in respect to FXOpen Companies products and services or as financial advice.