Daily Market Analysis By FXOpen
Turkish Lira has week of volatility as government takes drastic action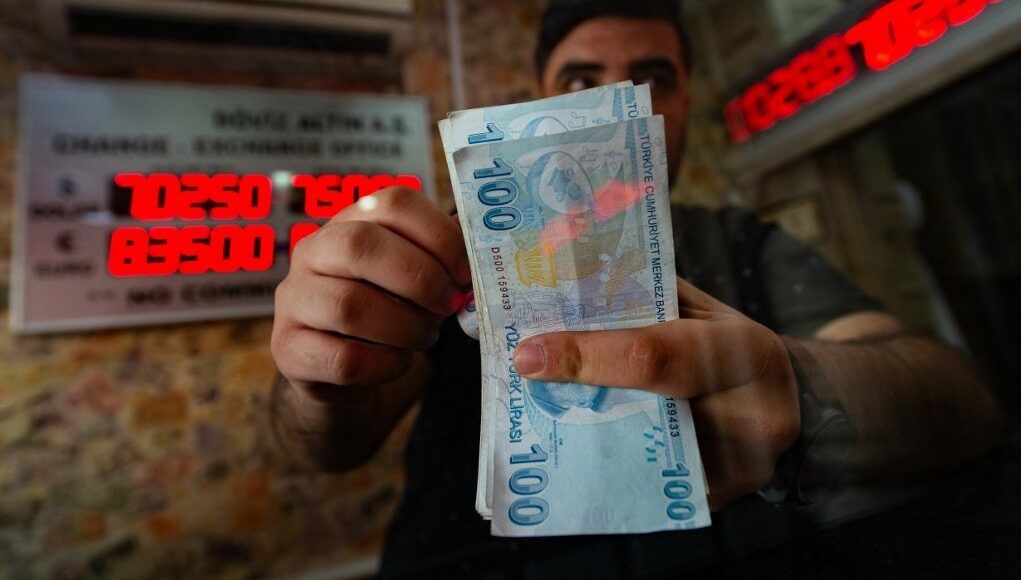
The Turkish Lira has been a currency that has held the international limelight for a few months now, largely due to the massive volatility that it has been experiencing as Turkey's national economy struggles with outlandish levels of inflation.
Over the last few months, Turkey has been battling inflation levels of approximately 70%, and the its national currency, the Lira, has been the subject of detailed analysis in that it has faced a severe crisis.
The Turkish Lira, although not a major currency, is widely traded against majors such as the Euro, US Dollar, Swiss Franc, Japanese Yen and British Pound and as a result of this status, it has been an important currency to monitor recently as the economic circumstances which the Turkish economy has faced impinge on its value.
This week, the Turkish government took drastic action by enforcing a ban on companies based in Turkey which have significant reserves of foreign currency from taking loans.
This resulted in an increase in the value of the Turkish Lira, however yesterday the Turkish Lira actually whipsawed against the US Dollar as the most interesting stage in a four-day rally in value by the Turkish currency.
Whipsawing is a term used by traders which describes a pattern in a volatile market in which a sharp price movement is suddenly followed by a sharp reversal.
In the case of the Turkish Lira, the currency rallied against the US Dollar on Friday last week, at one point surging by 5% against the US Dollar, which is the highest it has gained this year.
Overall on Friday, the Turkish Lira had traded up 2.5%, which is the biggest gain of any currency in the world against the US Dollar during Friday's trading session.
As this week has progressed, the upward trend continued for the Lira until yesterday, when it whipsawed.
By Monday morning this week, the Turkish Lira had gained an impressive 8% against the US Dollar, trading at 16.01 compared to Thursday's close of 17.35.
However, on Monday afternoon, late into the European trading session, the Turkish Lira whipsawed within the 16 to 17 Lira per US Dollar range.
These volatile movements reflected the varied opinions of investors regarding the new ban on loans to companies which hold reserves of non-Turkish currency.
The policy, which affects around 10,000 businesses in Turkey, means that if those companies wish to obtain commercial loans, they would have to sell a sufficient amount of their non-Turkish currency reserves on the Forex market and then buy Lira instead. The idea of this is to attempt to bolster the value of the embattled Turkish Lira which has lost half of its value in the past 12 months.
The new rule stipulates that all companies which hold the equivalent of 15 million Turkish Lira in non-Turkish currency, cannot borrow lira if their FX funds exceed 10% of their assets or yearly sales. 15 million Turkish Lira is approximately $910,000.
Smaller companies which cannot take loans in non-Turkish currency are exempt from this ruling as long as their FX position is net, and they are allowed to borrow in Lira.
The government's stringent action is indicative of the crisis which the Lira faces, as the inflation level reached 73% recently, removing the purchasing power of the vast majority of the nation's citizens and businesses.
The Lira is clearly now a volatile currency against majors and therefore one to watch.
FXOpen Blog
ETHUSD and LTCUSD Technical Analysis – 30th JUNE, 2022
ETHUSD – Bearish Doji Star Pattern Below $1279
Ethereum was unable to sustain its bullish momentum and after touching a high of 1278 on 26th June started to decline heavily against the US Dollar.
We can see that the prices have fallen below the $1100 handle and now trading at $1052 in the European Trading session today.
We can see the formation of a Falling Trend Channel below the $1200 handle and now we are looking at $1050 and $1000 as the immediate targets.
The prices touched an Intraday Low of $1049 in the European Trading session and an Intraday High of $1117 in the Asian Trading session today.
We can clearly see a Bearish Doji Star Pattern Below the $1279 handle which is a Bearish pattern and signifies the end of a Bullish phase and the start of a Bearish phase in the markets.
ETH is now trading below its Pivot levels of 1069 and is moving into a Strong Bearish channel. The price of ETHUSD is now testing its Classic support levels of 1015 and Fibonacci support levels of 1057 after which the path towards 1000 will get cleared.
Relative Strength Index is at 24 indicating an OVERSOLD market and the shift towards the consolidation phase in the markets.
Both the STOCHRSI and Williams Percent Range are indicating Oversold levels, which means that the prices are due to correct upwards in the short-term range.
All of the of the Technical indicators are giving a STRONG SELL market Signal.
All of the Moving Averages are giving a STRONG SELL Signal and we are now looking at the levels of $1000 to $950 in the short-term range.
ETH is now trading Below its both the 100 Hourly Simple and Exponential Moving Averages.
Ether Bearish Reversal seen Below the $1279 mark.
Short-term range appears to be Strongly BEARISH.
ETH failed to clear its resistance of $1300.
Average True Range is indicating LESS Market Volatility.
Ether Bearish Reversal Seen Below $1279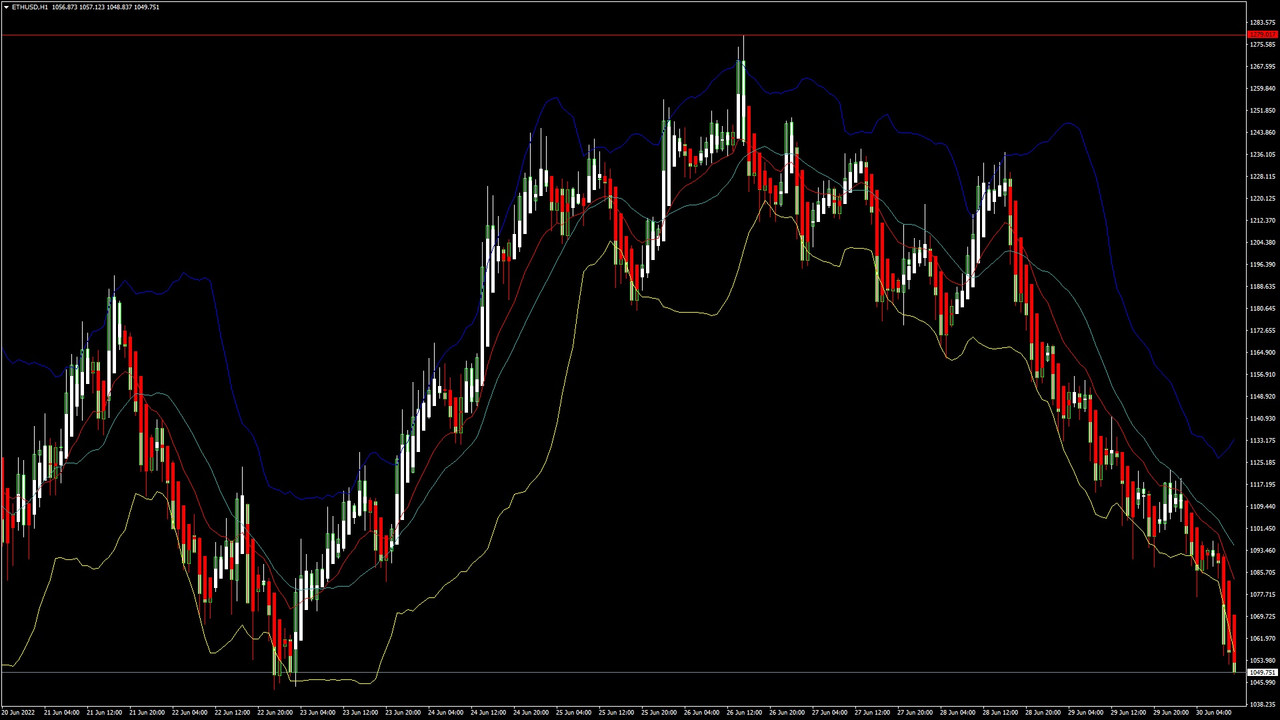
ETHUSD is now moving into a Strong Bearish Channel with the prices trading below the $1100 handle in the European Trading session today.
We have also detected the formation of a Bearish Harami pattern in the 15-minutes timeframe indicating weakness and the continuation of the downtrend.
The Commodity Channel Index is giving Oversold levels which means that the prices of Ethereum are due for an upwards correction.
The key support levels to watch are $1036 and $1015 and the prices of ETHUSD need to remain above these levels for any Bullish reversal.
ETH has decreased by 7.05% with a price change of 79$ in the past 24hrs and has a trading volume of 15.621 Billion USD.
We can see an Increase of 7.43% in the total trading volume in last 24 hrs. which appears to be Normal.
The Week Ahead
The global investor sentiments are weak due to the changing Geo-political situation in the Europe, amid the ongoing Russia-Ukraine conflict and meeting of NATO leaders in Madrid.
The prices of Ethereum continue to remain above the important psychological support levels of $1000 and most of the technical are now indicating a Neutral market.
The immediate short-term outlook for the Ether has turned as Strongly BEARISH, the medium-term outlook has turned NEUTRAL, and the long-term outlook for Ether is NEUTRAL in present market conditions.
In this week Ether is expected to move in a range between the $1000 and $1150 and in the next week Ether is expected to enter into a Consolidation phase above the $1100 levels.
Technical Indicators:
STOCH (9,6): It is at 38.51 indicating a SELL.
Average Directional Change(14days): It is at 40.18 indicating a SELL.
Rate of Price Change: It is at -4.50 indicating a SELL.
Ultimate Oscillator: It is at 34.22 indicating a SELL.
Read Full on FXOpen Company Blog...
AUD/USD and NZD/USD Could Eye Fresh Increase
AUD/USD started a fresh decline from the 0.6980 resistance. NZD/USD is also declining and might even trade below the 0.6150 support.
Important Takeaways for AUD/USD and NZD/USD
The Aussie Dollar started a fresh decline below the 0.6920 support zone against the US Dollar.
There is a key bearish trend line forming with resistance near 0.6880 on the hourly chart of AUD/USD.
NZD/USD also started a major decline from the 0.6330 resistance zone.
There is a major bearish trend line forming with resistance near 0.6215 on the hourly chart of NZD/USD.
AUD/USD Technical Analysis
The Aussie Dollar attempted a fresh increase above the 0.6980 and 0.7000 levels against the US Dollar. However, the AUD/USD pair failed to continue higher above 0.6980 and started another decline.
There was a move below the 0.6950 and 0.6920 support levels. There was a close below the 0.6900 level and the 50 hourly simple moving average. The pair traded as low as 0.6821 and is currently showing a lot of bearish signs.
AUD/USD Hourly Chart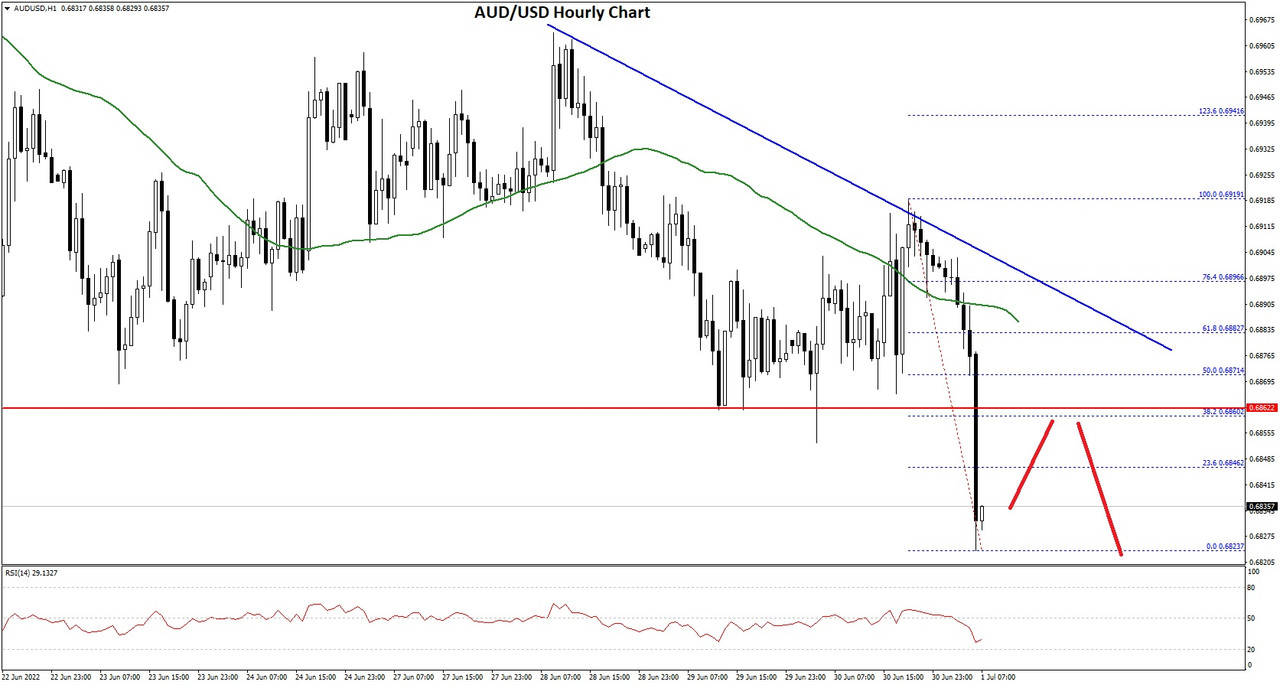
On the downside, an initial support is near the 0.6800 level. The next support could be the 0.6780 level. The main support is near the 0.6720 level. If there is a downside break below the 0.6720 support, the pair could extend its decline towards the 0.6650 level.
Any more downsides might send the pair toward the 0.6600 level. On the upside, the AUD/USD pair is facing resistance near the 0.6845 level. It is near the 23.6% Fib retracement level of the downward move from the 0.6919 swing high to 0.6821 low.
The next major resistance is near the 0.6870 level. It is near the 50% Fib retracement level of the downward move from the 0.6919 swing high to 0.6821 low.
There is also a key bearish trend line forming with resistance near 0.6880 on the hourly chart of AUD/USD. A close above the 0.6880 level could start a steady increase in the near term. The next major resistance could be 0.6950.
Read Full on FXOpen Company Blog...
GBP/USD and GBP/JPY Face Uphill Task
GBP/USD started a fresh decline from the 1.2320 resistance zone. GBP/JPY declined and remains at a risk of more losses below 162.00.
Important Takeaways for GBP/USD and GBP/JPY
The British Pound started a fresh decline after it failed near 1.2320 against the US Dollar.
There is a major bearish trend line forming with resistance near 1.2120 on the hourly chart of GBP/USD.
GBP/JPY declined steadily after it failed to clear the 167.00 resistance zone.
There is a key bearish trend line forming with resistance near 164.25 on the hourly chart.
GBP/USD Technical Analysis
This past week, the British Pound attempted an upside break above the 1.2320 resistance against the US Dollar. The GBP/USD pair failed to gain bullish momentum and started a fresh decline from the 1.2200 zone.
There was a sharp decline below the 1.2150 support and the 50 hourly simple moving average. The pair even traded below the 1.2000 support zone. A low was formed near 1.1975 on FXOpen before the pair started a recovery wave.
GBP/USD Hourly Chart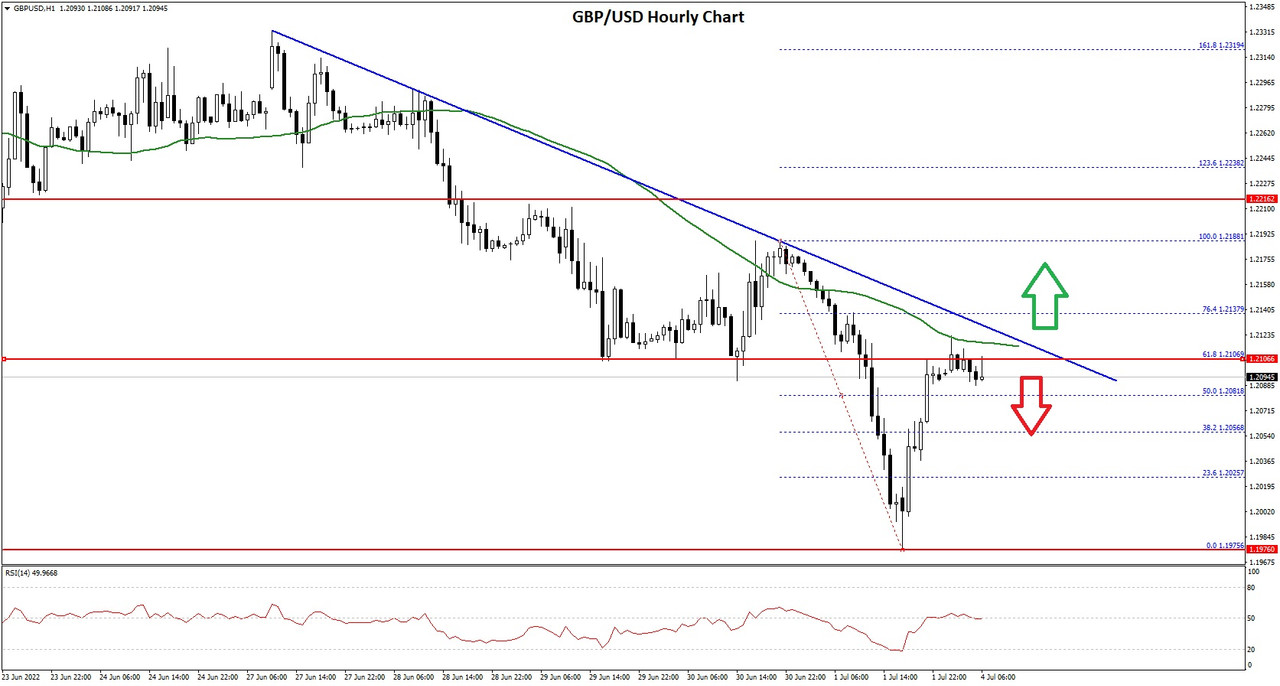
The pair climbed above the 1.2050 resistance zone. It even broke the 50% Fib retracement level of the downward move from the 1.2188 swing high to 1.1975 low.
On the upside, the pair is facing resistance near the 1.2110 level. It is near the 61.8% Fib retracement level of the downward move from the 1.2188 swing high to 1.1975 low. There is also a major bearish trend line forming with resistance near 1.2120 on the hourly chart of GBP/USD.
An upside break above 1.2120 could set the pace for a move towards the 1.2200 resistance zone. If there is no upside break above 1.2120, the pair could start a fresh decline.
An immediate support is near the 1.2050. The next major support is near the 1.2000 level. If there is a break below the 1.2000 support, the pair could test the 1.1920 support.
Read Full on FXOpen Company Blog...
US Dollar's sustained rally is surprising the markets, especially against Bitcoin
During the past few weeks, the US Dollar has been surprisingly strong against many western majors, notably the Euro and British Pound, despite the American and European economies facing very similar obstacles over the past two years.
This has been a particularly interesting dynamic, especially as the inflation levels among European Union member states, the United Kingdom and the United States are at levels not seen since the 1980s, and the geopolitical circumstances foist upon the citizens are similar.
The US Dollar also lost part of its status as a settlement instrument for global oil and gas purchasing a few months ago when the Russian government rolled out a new policy that ensures all Western buyers of oil and gas from Russia settle their deliveries in Rubles.
Despite all of this, the US Dollar has been performing well against its major peers, and perhaps more interestingly, against Bitcoin, too.
Last year, analysts in Wall Street predicted that the Bitcoin would go to $150,000 in value over the 'next few months'. This has not happened and in reality, Bitcoin' inverse correlation with the US Dollar actually hit a 17-month high yesterday.
It is unusual for analysts within Tier 1 banks in Wall Street to make incorrect predictions. They were right about the oil prices, afterall, when many analysts said in the summer of 2021 that Brent Crude would go to $80 per barrel by the autumn, as that is exactly what happened.
However, when it comes to Bitcoin, things have been less predictable, even by experts who have the credibility of a Tier 1 investment bank to uphold.
Bitcoin's current relatively low value has become a sustained circumstance, and now, market analysts are starting to comment that the US Dollar rally may either stll or correct by the end of 2022 against its fiat currency peers, which in turn may benefit Bitcoin.
This goes some way toward suggesting that Bitcoin is now almost behaving like an established currency in that its movements are less volatile than previously and than some altcoins, and that its future performance is being viewed via the same lens as the future performance of other major fiat currencies against the US dollar.
Importantly, the weekly correlation coefficient between Bitcoin and the US Dollar dropped to 0.77 below zero in the week ending July 3, its lowest in seventeen months.
It appears that investors are more confident in the performance of stock market indices than currencies during a time at which the central banks of Europe and the United States are engaged in interest rate increases as attempts to curb inflation.
The Federal Reserve Bank has invoked a series of rate hikes, as have the Bank of England and even the European Central Bank recently which invoked its first rate hike for several years.
Therefore, the currency market is in focus, and Bitcoin has lost 60% of its value so far in 2022, whereas the NASDAQ composite index, which is the home of many publicly listed technology companies, has only declined in returns by 29% over the same period.
As far as measuring the US Dollar against other currencies is concerned, the US Dollar is in a very good position as the US dollar index (DXY), which is a metric that measures its strength against a basket of top foreign currencies, has been recently consistent around its January 2003 highs of 105.78.
The fervent influx of new Bitcoin investors who took to the cryptocurrency market in 2021 after Elon Musk's famous tweet which collapsed the value of 5 popular cryptocurrencies by almost a trillion dollars has subsided. These were analytical investors who 'bought the dip' realizing that soon it would correct, and it did, soon after Elon Musk put out another tweet saying that the environmental factors he had previously cited had been resolved.
This level of volatility has not been experienced this year, and there are even market pundits saying that Bitcoin may have 'bottomed out', with one on-chain indicator predicting that Bitcoin could go to $15,600 as a low point this year.
It is an interesting time, and the fiat currency volatility, especially that of the US Dollar, and the tinderbox situation of many western economies plus the stagnancy of Bitcoin is a conundrum of a different nature to that of just a year ago.
FXOpen Blog
BTCUSD and XRPUSD Technical Analysis – 05th JULY 2022
BTCUSD: Bullish Doji Star Pattern Above $18900
Bitcoin was unable to sustain its bullish momentum last week and started to decline against the US dollar touching a low of 18646 on 30th June, after which we can see some correction in its levels above the $19000 handle.
The prices of bitcoin started to reverse, confirming the bullish tone in the markets. We can see a shift towards the consolidation channel above the $19500 handle in the European trading session today.
We can clearly see a bullish doji star pattern above the $18900 handle which is a bullish reversal pattern because it signifies the end of a downtrend and a shift towards an uptrend.
Both the STOCH and STOCHRSI are indicating overbought levels which means that in the immediate short term a decline in the prices is expected.
The relative strength index is at 56 indicating a STRONG demand for bitcoin at the current market levels.
Bitcoin is now moving below its 100 hourly simple moving average and its 200 hourly simple moving average.
All of the major technical indicators are giving a strong buy signal, which means that in the immediate short term, we are expecting targets of 20500 and 22000.
The average true range is indicating less market volatility with a bullish momentum.
Bitcoin: bullish reversal seen above $18900
The Williams percent range is indicating an overbought level
The price is now trading just below its pivot level of $20266
Some of the moving averages are giving a buy market signal
Bitcoin: Bullish Reversal Seen Above $18900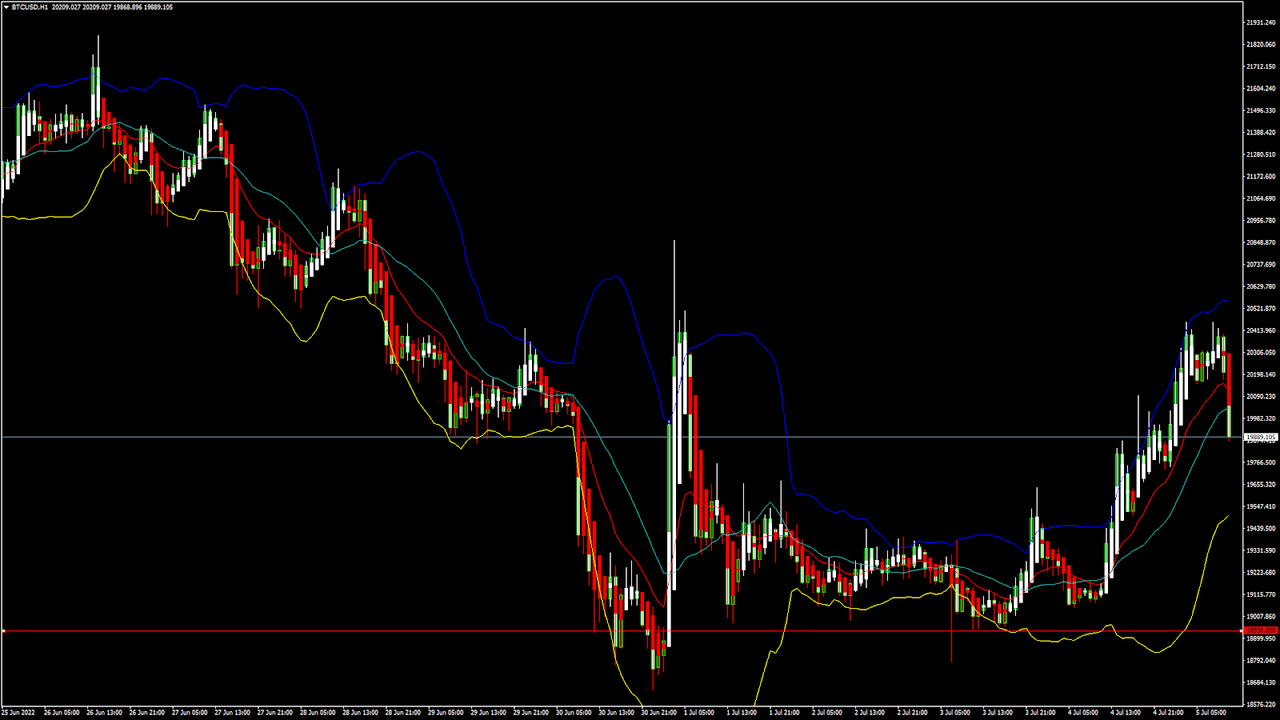
The price of Bitcoin has entered into a consolidation channel above the $19000 handle and the continuation of the bullish momentum above the $19500 level.
The global sentiments continue to improve, and now the prices are forming an ascending channel above the $19000 level.
A bullish run is expected up to the level of $24821 as indicated by the simple MA 200, after which we will see some downwards correction.
The on-chain activity has increased which points to a potential bullish nature of the prevailing market conditions.
The immediate short-term outlook for bitcoin is Bullish; the medium-term outlook has turned neutral; and the long-term outlook remains neutral under present market conditions.
Bitcoin is finding support above the $18500 level as the prices continue to remain above these levels during the bearish phase of the markets.
The price of BTCUSD is now facing its classic resistance level of 20365 and Fibonacci resistance level of 20527 after which the path towards 21000 will get cleared.
In the last 24hrs, BTCUSD has increased by 3.89% by 745$ and has a 24hr trading volume of USD 24.759 billion. We can see an increase of 61.73% in the trading volume as compared to yesterday, which is due to the buying seen at lower levels by the medium-term Investors.
The Week Ahead
The price of bitcoin is moving in a bullish momentum, and the immediate targets are $20500 and $21500. The daily RSI is printing at 35 which means that the medium range demand continues to be weak.
We can see that the prices of bitcoin have stabilized above the $19000 handle, and now we are looking at the important support levels of $18847 and $19150.
The price of BTCUSD will need to remain above the important support level of $19000 this week.
The weekly outlook is projected at $22500 with a consolidation zone of $20500.
Technical Indicators:
The average directional change (14 days): at 33.00 indicating a BUY
The ultimate oscillator: at 51.57 indicating a BUY
The rate of price change: at 3.075 indicating a BUY
The commodity channel index (14 days): at 92.63 indicating a BUY
Read Full on FXOpen Company Blog...
EUR/USD and EUR/JPY Remain In Downtrend
EUR/USD started a fresh decline and traded below 1.0350. EUR/JPY is also diving and remains at a risk of more losses below 138.50.
Important Takeaways for EUR/USD and EUR/JPY
The Euro started a major decline from the 1.0500 and 1.0480 resistance levels.
There is a key bearish trend line forming with resistance near 1.0400 on the hourly chart.
EUR/JPY also started a major decline below the 140.50 and 140.00 support levels.
There is a major bearish trend line forming with resistance near 141.50 on the hourly chart.
EUR/USD Technical Analysis
The Euro failed to clear the 1.0500 resistance against the US Dollar. The EUR/USD pair started a major decline below the 1.0450 and 1.0350 support levels.
There was a clear move below the 1.0320 level and the 50 hourly simple moving average. The pair even settled below the 1.0280 level. A low was formed near 1.0235 on FXOpen and the pair is now consolidating losses.
EUR/USD Hourly Chart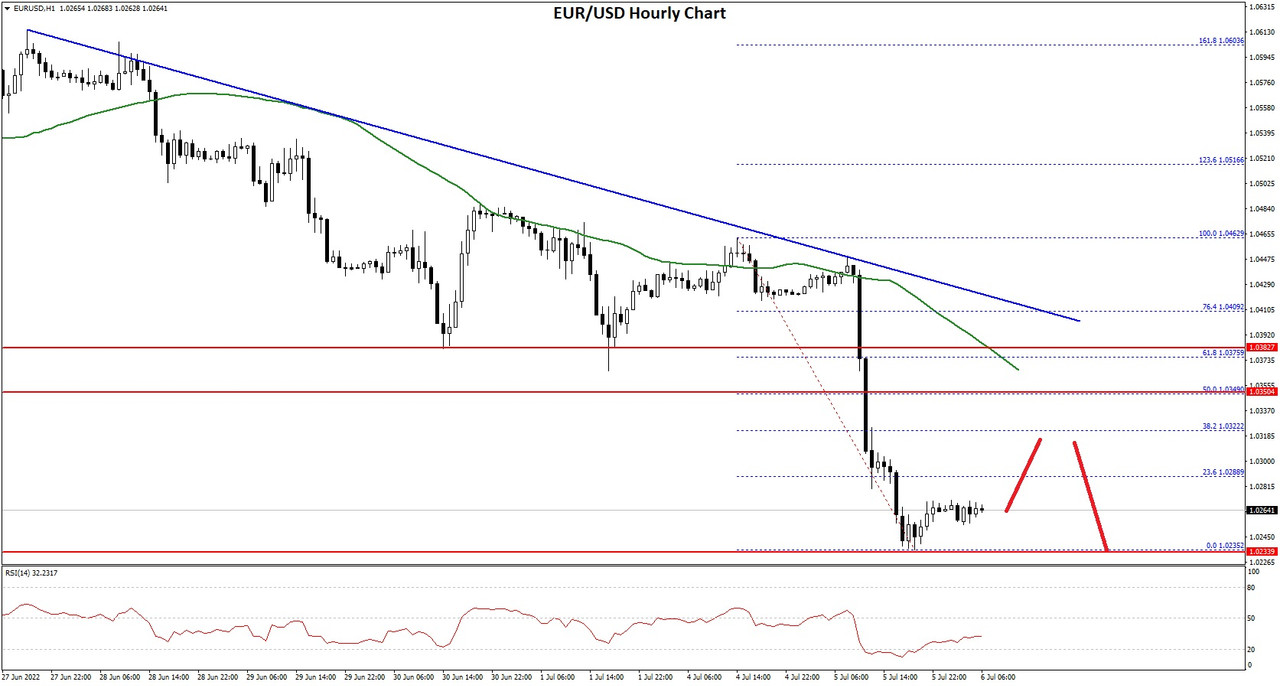
On the upside, the pair is facing resistance near the 1.0290 level. It is near the 23.6% Fib retracement level of the downward move from the 1.0462 swing high to 1.0235 low.
The next major resistance is near the 1.0350 level. It is near the 50% Fib retracement level of the downward move from the 1.0462 swing high to 1.0235 low. Besides, there is a key bearish trend line forming with resistance near 1.0400 on the hourly chart.
A clear break above the 1.0400 resistance could push EUR/USD towards 1.0500. If the bulls remain in action, the pair could revisit the 1.0550 resistance zone in the near term.
On the downside, the pair might find support near the 1.0235 level. The next major support sits near the 1.0200 level. If there is a downside break below the 1.0200 support, the pair might accelerate lower in the coming sessions.
Read Full on FXOpen Company Blog...
GBP falls to 1.20 against the US Dollar amid British government uncertainty
The British Pound slid once again during the early hours of this morning to 1.20 against the US Dollar, signaling a return to the low point that it reached last week.
This morning's slump for the British Pound takes place during a time at which the current British government is in turmoil, with two senior ministers having resigned from their positions during the late hours of yesterday.
Rishi Sunak, the Chancellor of the Exchequer (Finance Minister) resigned, as did his colleague Sajid Javid, who had until yesterday held the position of Secretary of State for Health and Social Care.
This has raised a lot of speculation within the United Kingdom regarding the longevity of the current government, and whether prime minister Boris Johnson will follow suit, or whether he will hang onto his position until potentially ousted by his own party.
Either way, there is a reflection on the policies implemented over the past two years by the current government, including the fiscal policies of Rishi Sunak who has now made for the hills. Those included furlough schemes, which paid people to stay off work and comply with lockdowns, at great cost to the taxpayer and overall economic growth.
The blame for the cost of living crisis which is currently ongoing within the United Kingdom, and the increasing interest rates to curb inflation that is at a 40 year high is being laid at the door of the government, and therefore all eyes are on the next move from within Parliament.
Confidence in the British Pound this morning is therefore low, as it is very difficult to gauge whether the current government will soldier on, or whether an election may be called.
Meanwhile, the US Dollar continues its strong dynamic despite inflation levels in the United States being at their highest level in 40 years, and multiple interest rate increases by the Federal Reserve bank, and the Euro lags only marginally behind the US Dollar, with the European Central Bank having only made one interest rate rise during this period of high inflation across the Western world.
It is a volatile period as far as geopolitical activity is concerned, and the value of the GBPUSD is a clear demonstration of where the current market confidence lies.
Overall, Britain's economic situation is very stable, and perhaps more so than that of the United States on a very general level, but the policies and confidence in the current administration on both sides of the Atlantic is waning fast, with some of Britain's top ministers taking their final paychecks first.
FXOpen Blog
ETHUSD and LTCUSD Technical Analysis – 07th JULY, 2022
ETHUSD: Bullish Doji Star Pattern Above $1040
Ethereum has started its bullish momentum against the US dollar after moving into a consolidation channel last week and is now trading above the $1100 handle in the US trading session.
We can see a continued appreciation in the prices of Ethereum, mainly due to the buying seen at lower levels by the medium-term investors.
We can see the formation of a super trend in the 15-minute time frame above the $1100 handle, and now are looking at $1200 and $1250 as the immediate targets.
The prices touched an intraday low of $1155 in the Asian trading session and an intraday high of $1201 in the European trading session today.
We can clearly see a bullish doji star pattern above the $1040 handle which is a bullish pattern and signifies the end of a bearish phase and the start of a bullish phase in the markets.
ETH is now trading above its pivot level of 1182 and moving into a mildly bullish channel. The price of ETHUSD is now testing its classic resistance level of 1190 and Fibonacci resistance level of 1197 after which the path towards 1200 will get cleared.
The relative strength index is at 61 indicating a STRONG market and the continuation of the uptrend in the markets.
The STOCHRSI is indicating a NEUTRAL level, which means that the prices are expected to enter into a consolidation phase in the short-term range.
All of the technical indicators are giving a STRONG BUY market signal.
All of the moving averages are giving a STRONG BUY signal, and we are now looking at the levels of $1200 to $1250 in the short-term range.
ETH is now trading above its 100 hourly simple and exponential MAs.
Ether: bullish continuation seen above the $1040 mark
The short-term range appears to be mildly BULLISH
ETH continues to remain above the $1100 level
The average true range is indicating LESS market volatility
Ether: Bullish Continuation Seen Above $1040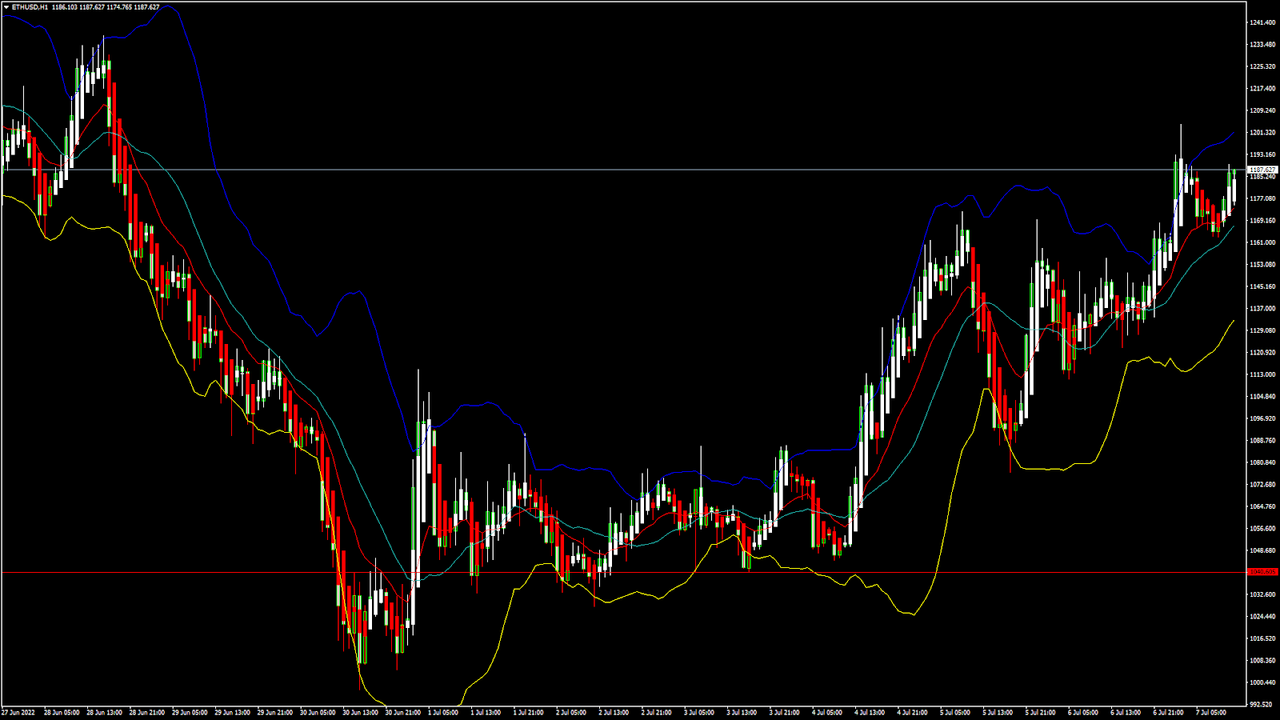
ETHUSD is now moving into a mildly bullish channel with the prices trading above the $1100 handle in the European trading session today.
We have also detected the formation of an ascending contraction triangle pattern in the hourly time frame indicating that the price is likely to climb higher crossing the $1200 level.
We can see that the price of Ethereum is slowly recovering against the US dollar and continues to gain traction today.
The current price action is positive for the markets, and the prices are expected to remain above the $1200 levels in the US trading session today.
The key support levels to watch are $1100 and $1159, and the prices of ETHUSD need to remain above these levels for the continuation of the bullish trend.
ETH has decreased by 3.30% with a price change of 37$ in the past 24hrs and has a trading volume of 13.489 billion USD.
We can see a decrease of 20.16% in the total trading volume in the last 24 hrs. which appears to be normal.
The Week Ahead
The on-chain data shows that the number of ETH holders is increasing which suggests that the global user activity is at an all-time high leading to an increase in the global investor sentiment.
The prices of Ethereum continue to remain above the important psychological support level of $1100 and most of the technicals are now indicating a bullish market.
The immediate short-term outlook for Ether has turned strongly BULLISH; the medium-term outlook has turned NEUTRAL; and the long-term outlook for Ether is NEUTRAL in present market conditions.
This week, Ether is expected to move in a range between $1100 and $1300, and next week, it is expected to enter into a consolidation phase above $1200.
Technical Indicators:
The moving averages convergence divergence (12,26): at 9.93 indicating a BUY
The average directional change (14 days): at 33.57 indicating a BUY
The rate of price change: at 2.59 indicating a BUY
The ultimate oscillator: at 56.07 indicating a BUY
Read Full on FXOpen Company Blog...
Gold Price Turns Red, Crude Oil Price Faces Hurdle

[I]Gold price started a major decline below the $1,800 support zone. Crude oil price is attempting a recovery wave from the $93.20 zone.[/I]
Important Takeaways for Gold and Oil
Gold price struggled above $1,800 and declined against the US Dollar.
There is a key bearish trend line forming with resistance near $1,750 on the hourly chart of gold.
Crude oil price started a downside correction from the $109 and $110 resistance levels.
There is a major bearish trend line forming with resistance near $100.10 on the hourly chart of XTI/USD.
Gold Price Technical Analysis
Gold price struggled to gain pace above the $1,815 resistance zone against the US Dollar. The price started a fresh decline and traded below the $1,800 pivot level.
There was a clear move below the $1,785 support zone and the 50 hourly simple moving average. The price even traded below the $1,750 level and formed a low near $1,732 on FXOpen. It is now consolidating losses above the $1,730 level.
Gold Price Hourly Chart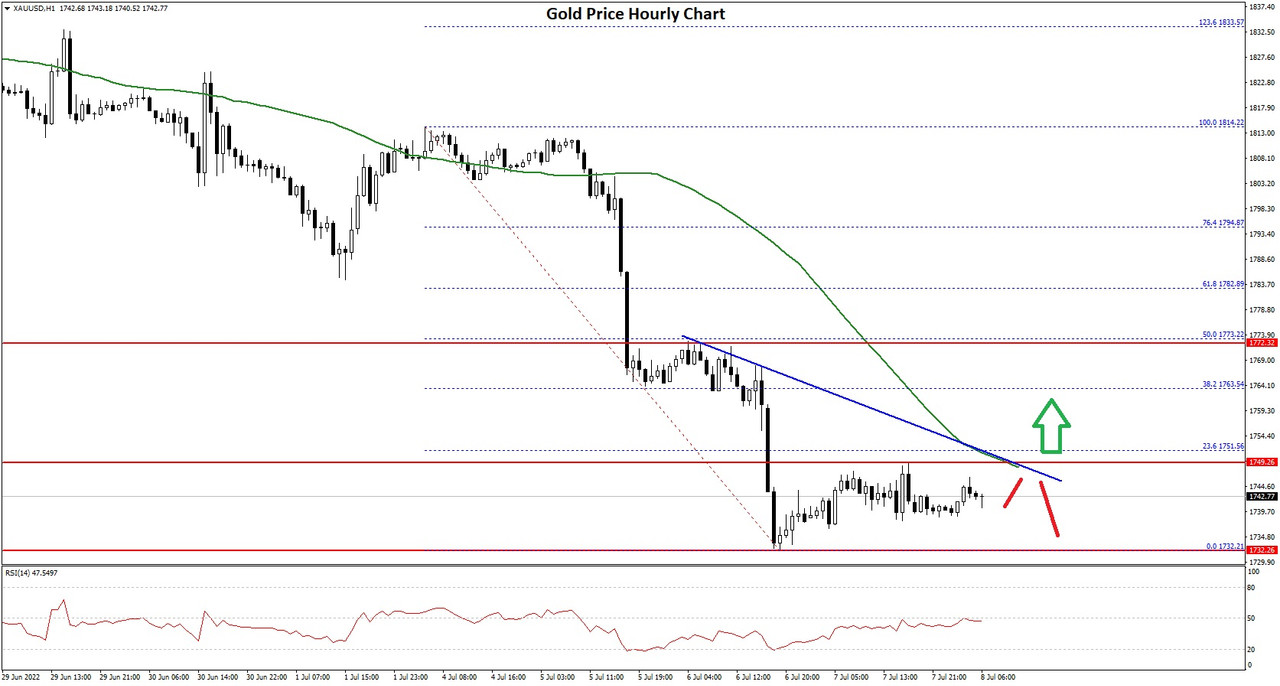
On the upside, the price is facing resistance near the $1,750 level. There is also a key bearish trend line forming with resistance near $1,750 on the hourly chart of gold.
The trend line is near the 23.6% Fib retracement level of the downward move from the $1,814 swing high to $1,732 low. A clear upside break above the trend line and the 50 hourly simple moving average could send the price towards $1,762.
The main resistance is now forming near the $1,775 level. It is near the 50% Fib retracement level of the downward move from the $1,814 swing high to $1,732 low.
A close above the $1,775 level could open the doors for a steady increase towards $1,800. The next major resistance sits near the $1,815 level. On the downside, an initial support is near the $1,735 level. The next major support is near the $1,725 level, below which there is a risk of a larger decline. In the stated case, the price could decline sharply towards the $1,700 support zone.
Read Full on FXOpen Company Blog...