Daily Market Analysis By FXOpen
Watch FXOpen's January 23 - 27 Weekly Market Wrap Video
In this video, FXOpen UK COO Gary Thomson sums up the week’s happenings and discusses the most significant news reports.
[*] Monday morning blues as EY forecast worse UK recession than expected
[*] Natural gas fell by 50% in 1 month
[*] Big Tech woes lead to layoffs, resulting in stock surge
[*] TSLA. Report reassures investors
Watch our short and informative video, and stay updated with FXOpen.
FXOpen YouTube
Disclaimer: This forecast represents FXOpen Companies opinion only, it should not be construed as an offer, invitation or recommendation in respect to FXOpen Companies products and services or as financial advice.
GBP/USD and GBP/JPY Could Resume Increase
GBP/USD is consolidating gains pace above the 1.2350 zone. GBP/JPY is also rising and might gain pace if it clears the 161.80 resistance zone.
Important Takeaways for GBP/USD and GBP/JPY
[*] The British Pound is showing positive signs above 1.2350 against the US Dollar.
[*] There is a key contracting triangle forming with resistance near 1.2400 on the hourly chart of GBP/USD.
[*] GBP/JPY started a fresh increase above the 160.00 resistance zone.
[*] There is a major bullish trend line forming with support near 160.90 on the hourly chart.
GBP/USD Technical Analysis
This past week, the British Pound found support near the 1.2280 zone against the US Dollar. The GBP/USD pair formed a base and started a steady increase above the 1.23200 level.
There was a clear move above the 1.2350 resistance and the 50 hourly simple moving average. The pair even cleared the 1.2400 resistance. A high is formed near 1.2418 on FXOpen and the pair corrected lower.
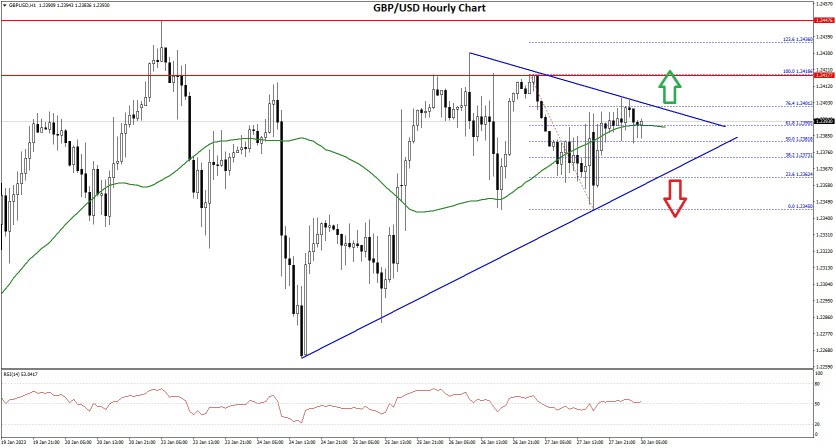
GBP/USD Hourly Chart
There was a move below the 1.2380 level, but the bulls were active near the 1.2345. The pair is now rising and trading above the 50% Fib retracement level of the recent decline from the 1.2418 swing high to 1.2345 low.
An immediate resistance on the upside is near the 1.2400 level. There is also a key contracting triangle forming with resistance near 1.2400 on the hourly chart of GBP/USD.
The triangle resistance is near the 76.4% key contracting triangle forming with resistance near 1.2400 on the hourly chart of GBP/USD. The next major resistance is near the 1.2420 level, above which the pair could start a steady increase towards 1.2450.
An upside break above 1.2450 might start a fresh increase towards 1.2550. Any more gains might call for a move towards 1.2600 or even 1.2640.
An immediate support is near the 1.2380. The next major support is near the 1.2350 level. If there is a break below the 1.2350 support, the pair could test the 1.2280 support. Any more losses might send GBP/USD towards 1.2220.
VIEW FULL ANALYSIS VISIT - FXOpen Blog...
Disclaimer: This Forecast represents FXOpen Companies opinion only, it should not be construed as an offer, invitation or recommendation in respect to FXOpen Companies products and services or as Financial Advice.