Daily Market Analysis By FXOpen
Watch FXOpen's December 12 - 16 Weekly Market Wrap Video
In this video, FXOpen UK COO Gary Thomson sums up the week’s happenings and discusses the most significant news reports.
[*] Sudden gold price hike attracts speculative attention
[*] What the future holds for the Fed
[*] EUR/USD gains bullish momentum while USD/CHF dips further
[*] GBP makes remarkable gains as UK inflation slows, but it's still 10.7%
Watch our short and informative video and stay updated with FXOpen.
FXOpen YouTube
Disclaimer: This forecast represents FXOpen Companies opinion only, it should not be construed as an offer, invitation or recommendation in respect to FXOpen Companies products and services or as financial advice.
GBP/USD and GBP/JPY Could Extend Downsides
GBP/USD started a downside correction from the 1.2445 resistance. GBP/JPY declined and remains at a risk of more losses below the 165.25 zone.
Important Takeaways for GBP/USD and GBP/JPY
[*] The British Pound struggled to clear the 1.2445 resistance zone against the US Dollar.
[*] There was a break below a key bullish trend line with support near 1.2320 on the hourly chart of GBP/USD.
[*] GBP/JPY started a fresh decline from the 168.80 resistance zone.
[*] There was a break below a major bullish trend line with support near 167.20 on the hourly chart.
GBP/USD Technical Analysis
This past week, the British Pound found support near the 1.2150 zone against the US Dollar. The GBP/USD pair formed a base and started a steady recovery wave above the 1.2320 level.
There was a clear move above the 1.2400 resistance and the 50 hourly simple moving average. However, the pair struggled to clear the 1.2445 resistance zone. A high was formed near 1.2446 on FXOpen and the pair started a downside correction.
GBP/USD Hourly Chart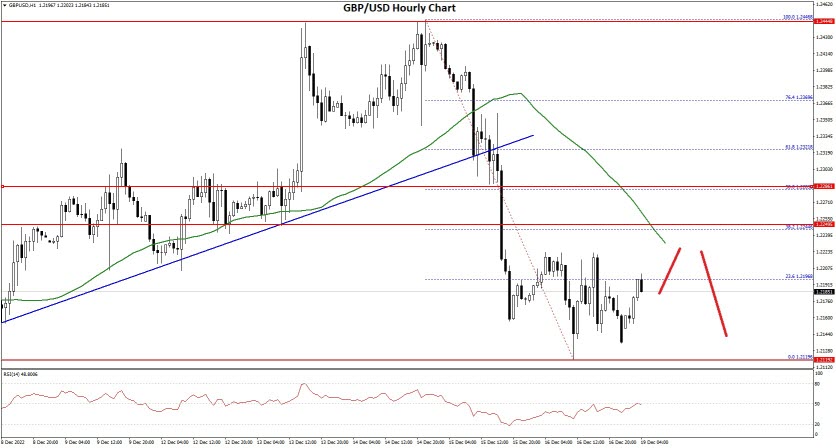
There was a move below the 1.2350 support and the 50 hourly simple moving average. Besides, there was a break below a key bullish trend line with support near 1.2320 on the hourly chart of GBP/USD.
The pair traded as low as 1.2119 and recently corrected losses. It tested the 23.6% Fib retracement level of the downward move from the 1.2446 swing high to 1.2119 low. An immediate resistance on the upside is near the 1.2240 level.
The next major resistance is near the 1.2265 level or the 50% Fib retracement level of the downward move from the 1.2446 swing high to 1.2119 low, above which the pair could start a steady increase towards 1.2320.
An upside break above 1.2320 might start a fresh increase towards 1.2400. Any more gains might call for a move towards 1.2445 or even 1.2500.
An immediate support is near the 1.2150. The next major support is near the 1.2120 level. If there is a break below the 1.2120 support, the pair could test the 1.2050 support. Any more losses might send GBP/USD towards 1.2000.
VIEW FULL ANALYSIS VISIT - FXOpen Blog...
Disclaimer: This forecast represents FXOpen Companies opinion only, it should not be construed as an offer, invitation or recommendation in respect to FXOpen Companies products and services or as financial advice.
FTSE 100 begins slow recovery from 1 month low
The FTSE 100 index , which is the index containing the 100 most prestigious companies on the London stock exchange plummeted to a one month low on Friday.
There has been some degree of volatility in that particular index during the course of the last 30 days, but overall it has been quite steady and fans back each day.
On Friday, December 16 however, it’s suddenly plunged to 7306, representing its lowest point by far in over 30 days.
Just three days earlier the FTSC 100 index was standing at a very healthy 7526 so to plunge more than 200 points in three days is quite a downward spiral.
Perhaps some of the reason, for it is actually short term rather than anything to do with an overall lingering knowledge that the UK economy is generally struggling and has been for some time.
In fact, some analysts are noting that this is more to do with strikes in the public sector which are taking place during the course of this week having started on Friday last week, which coincides with the sudden plunge of the FTSE 100 index, and that these public sector strikes which affect the logistics and civil service could impede the operations of large corporations.
This would make sense, because of course, everybody is already accustomed to the difficulty economic circumstances which surround the overall UK economy there for such circumstances, would not be likely to have caused the sudden downturn in share performance.
It is, therefore, perhaps, worth looking out for how the FTSE 100 index performs after the strikes have finished and a possible settlement with workers unions may well be reached.
VIEW FULL ANALYSIS VISIT - FXOpen Blog...
Disclaimer: This forecast represents FXOpen Companies opinion only, it should not be construed as an offer, invitation or recommendation in respect to FXOpen Companies products and services or as financial advice.
Will the EURUSD pair go back below parity?
There has been a lot of volatility in the major currency markets recently, and the surprising strength of the US Dollar is perhaps part of the reason.
Whilst the United States While the United States economy languishes in a similar position to that of Europe, the dollar has somehow managed to maintain headway. It has been very strong throughout the course of the last part of this year.
Maybe that is why there is a degree of volatility between the US Dollar and its Western major peers.
Largely because given the high inflation, and uncertain future of the United States economic base, which has been subject to downturns in the value of the stocks of previously stable big tech giants as well as very high inflation which has now subsided, perhaps it would’ve been easier to guess that the dollar would be subjected to the same kind of low values of the euro and British pound - but that simply has not been the case .
Now that United States inflation is actually decreased and inflation in Europe, and Britain remains very high in double figures that has been a surprising turn of events which has seen the dollar rise again.
Now analysts at Rabobank have predicted that the euro might be in for a difficult time in early 2023 I never even gone to far as to say that it might move below parity with the dollar.
The euro being below parity with the dollar has happened before, of course, but given the strength of the dollar over the last few months, it would be quite surprising if it happened again .
With US inflation now down to around 7.7% it would be easy to guess that the US economy is showing signs of restructuring itself and repairing however, those high cost associated with doing business in Europe and Britain no way heavy on big American corporations because they have to pay the continually increasing prices associated with the European size of Atlantic, which has very high inflation so that is likely to bear some extreme cost to American companies and perhaps cause invested in stocks in touch companies to take a conservative view in case the earnings are less than they might otherwise be.
Either way, a major Tier 1 bank stating that the Euro may go back below parity is definitely something to look carefully at.
VIEW FULL ANALYSIS VISIT - FXOpen Blog...
Disclaimer: This forecast represents FXOpen Companies opinion only, it should not be construed as an offer, invitation or recommendation in respect to FXOpen Companies products and services or as financial advice.
BTCUSD and XRPUSD Technical Analysis – 20th DEC 2022
BTCUSD: Bullish Harami Pattern Above $16325
Bitcoin was unable to sustain its bullish momentum and after touching a high of $18360 on 14th Dec, the price started to decline against the US dollar coming down below the $16500 handle in the early Asian trading session today.
The price of bitcoin has since bounced back from its lows touching $16800 levels in the European Trading session today.
We have seen a bullish opening of the markets this week.
We can clearly see a bullish harami pattern above the $16325 handle which is a bullish reversal pattern because it signifies the end of a downtrend and a shift towards an uptrend.
Bitcoin touched an intraday low of 16322 in the Asian trading session and an intraday high of 16846 in the European trading session today.
We can see the formation of the bullish trend reversal pattern with the adaptive moving average AMA20 and MA20 in the 4-hour time frame.
Both the RSI and STOCHRSI are indicating overbought levels which means that in the immediate short term, a decline in the prices is expected.
The relative strength index is at 75 indicating an OVERBOUGHT level for bitcoin, and the possibility of an immediate correction in the price towards the $16500 levels.
Bitcoin is now moving above its 100 hourly simple moving average and below its 200 hourly exponential moving average.
All of the major technical Indicators are giving a STRONG BUY signal, which means that in the immediate short term, we are expecting targets of 17000 and 18500.
The average true range is indicating high market volatility with a strong bullish momentum.
[*] Bitcoin: bullish reversal seen above $16325
[*] The Williams percent range is indicating an overbought level
[*] The price is now trading just below its pivot level of $16822
[*] The short-term range is mildly bullish
Bitcoin: Bullish Reversal Seen Above $16325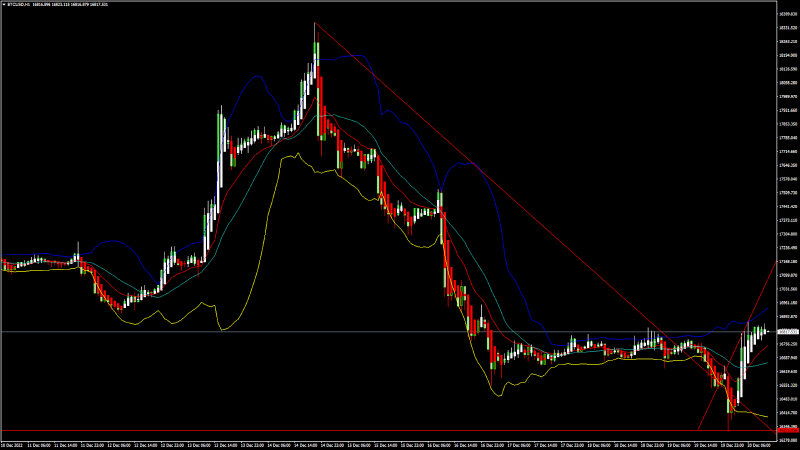
We can now see that the price of bitcoin is moving in a mildly bullish momentum, and we are expecting moves towards the $17000 levels before any market consolidation this week.
Some of the technical indicators are also giving a neutral tone of the markets.
We are now waiting for the next upwards leg above the $17500 handle which will push the prices towards the $18000 level.
The price of bitcoin is expected to enter into a super bullish zone after crossing the $18000 level.
The immediate short-term outlook for bitcoin is strongly bullish, the medium-term outlook has turned bullish, and the long-term outlook remains neutral under present market conditions.
Bitcoin’s support zone is located at $16329 which is a 3-10 day MACD oscillator stalls.
The price of BTCUSD is now facing its classic resistance level of 16862 and Fibonacci resistance level of 16885 after which the path towards 17500 will get cleared.
In the last 24hrs, BTCUSD has increased by 0.28% by 47.59$ and has a 24hr trading volume of USD 21.646 billion. We can see an increase of 72.88% in the trading volume compared to yesterday, which is due to heavy buying action seen at lower levels.
The Week Ahead
Bitcoin’s price is gaining pace above the $16000 handle and might soon break the $17000 level for more gains above $18000.
The price of Bitcoin has failed to clear the resistance at $18360 and we are now again testing the $18000 level soon.
The start of the festive season with Christmas and New Year holidays might dampen the interest of the global investors, and we will have to wait for the New Year 2023.
The daily RSI is printing at 46 which indicates a NEUTRAL demand for bitcoin and the possibility of a shift towards the consolidation/correction phase for a short term in the markets.
The price of BTCUSD is now facing its resistance zone at $17789 which is a 38.2% retracement from a 13 week low.
The weekly outlook is projected at $18000 with a consolidation zone of $17500.
[B]Technical Indicators:[/B]
The average directional index, ADX (14): is at 36.24 indicating a BUY
The ultimate oscillator: is at 58.98 indicating a BUY
The rate of price change, ROC: is at 1.246 indicating a BUY
Bull/bear power (13): is at 144.44 indicating a BUY
VIEW FULL ANALYSIS VISIT - FXOpen Blog...
Disclaimer: This forecast represents FXOpen Companies opinion only, it should not be construed as an offer, invitation or recommendation in respect to FXOpen Companies products and services or as financial advice.
EUR/USD Approaches Breakout While EUR/JPY Takes A Hit
EUR/USD is consolidating below the 1.0650 resistance zone. EUR/JPY declined heavily below 143.00 and is currently attempting a recovery wave.
Important Takeaways for EUR/USD and EUR/JPY
[*] The Euro started a downside correction from the 1.0735 resistance zone.
[*] There is a key contracting triangle forming with support near 1.0600 on the hourly chart.
[*] EUR/JPY started a strong decline and settled below the 142.50 support zone.
[*] There was a break below two bullish trend lines with support at 145.80 and 145.55 on the hourly chart.
EUR/USD Technical Analysis
The Euro formed a base above the 1.0550 zone and started a decent increase against the US Dollar. The EUR/USD pair was able to clear the 1.0650 and 1.0680 resistance levels.
There was a clear move above the 1.0700 level and the 50 hourly simple moving average. The pair even climbed above 1.0720 and traded as high as 1.0735 on FXOpen. Recently, there was a downside correction below the 1.0650 support zone.
EUR/USD Hourly Chart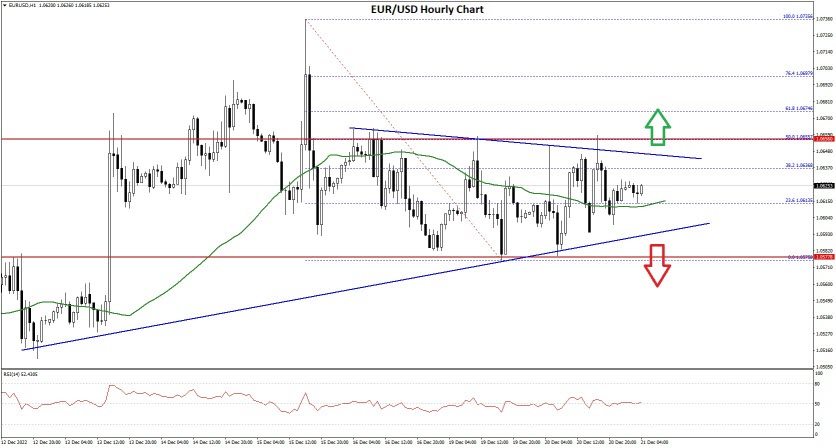
The pair even tested the 1.0580 level and started a consolidation phase. On the upside, an immediate resistance is near the 1.0635 level. It is near the 38.2% Fib retracement level of the downward move from the 1.0735 swing high to 1.0575 low.
The next major resistance is near the 1.0650 level. There is also a key contracting triangle forming with support near 1.0600 on the hourly chart.
The 50% Fib retracement level of the downward move from the 1.0735 swing high to 1.0575 low also sits near 1.0655. A clear move above the 1.0655 resistance might send the price towards 1.0700. If the bulls remain in action, the pair could visit the 1.0750 resistance zone in the near term.
On the downside, the pair might find support near the 1.0600 level. The next major support sits near the 1.0585 level, below which the pair could even test the 1.0520 support zone.
If there is a downside break below the 1.0520 support, the pair might accelerate lower in the coming sessions. In the stated case, it could even test 1.0425.
VIEW FULL ANALYSIS VISIT - FXOpen Blog...
Disclaimer: This forecast represents FXOpen Companies opinion only, it should not be construed as an offer, invitation or recommendation in respect to FXOpen Companies products and services or as financial advice.
Gold price challenges the Dollar again - but for how long?
Last week, some of the more adventurous analysts at the Tier 1 banks made the outlandish prediction that Gold may approach double the value that it is currently trading at during the course of 2023.
This may have appeared to be somewhat stratospheric and hard to imagine, however there certainly has been some volatility recently which is perhaps unusual for a solid commodity which has been viewed as a steady store of value for generations.
This week is no exception. Whilst the value of Gold against the US Dollar is nowhere near the $1785 per ounce that it reached in the beginning of November, it has recovered well from the sudden drop that took place in mid-November as the US Dollar has begun to slide from its position of strength which it held for the majority of this year.
Two weeks ago, Gold had dropped to $1629 per ounce, which is some decline in a short space of time, but it has been climbing since.
Today, a noticeable upward line is displayed when looking at the chart, and gold is trading at $1812 per ounce which is its highest point against the US Dollar since mid-July.
During the course of the US trading session yesterday, there was some degree of sentiment that suggested Gold prices may continue to fall, which runs contrary to its current performance. Despite this, traders were less net-long than Monday and compared with last week. Recent changes in sentiment warn that the current Gold price trend may soon reverse higher despite the fact traders remain net-long.
Part of the reason for this level of gain in value is that the US Dollar has slid in value against other currencies and in turn against commodities due to the inflation rate in the United States having reduced to around 7.7% whereas in Western Europe and the United Kingdom it remains over 10% and in parts of Eastern Europe it stands at 25%.
This has resulted in extra costs for big corporations based in the United States when doing business with overseas suppliers and customers, as well as operating their own subsidiaries in Europe as they have to pay more Dollars for the same services or products as the domestic US inflation level goes down whilst it remains high in Europe.
In this case, it is bizarre to consider, but despite the lower inflation rate in the US, the Dollar has depreciated because of the constantly increasing costs in Europe.
Gold as a store of value is a de facto 'safety net' worldwide, therefore perhaps storing value in a physical commodity is a way of avoiding instability and volatility in liquid currency markets.
On this basis, Gold has a long way to go before it gets near last week's outlandish prediction that it may reach $3000 in 2023, but at $1812 it is heading in a steep upward direction.
VIEW FULL ANALYSIS VISIT - FXOpen Blog...
[B]Disclaimer:[/b] This forecast represents FXOpen Companies opinion only, it should not be construed as an offer, invitation or recommendation in respect to FXOpen Companies products and services or as financial advice.
ETHUSD and LTCUSD Technical Analysis – 22nd DEC, 2022
ETHUSD: Bullish Harami Pattern Above $1152
Ethereum was unable to sustain its bearish momentum and after touching a low of 1152 on 20th Dec, the price started to correct upwards against the US dollar crossing the $1200 handle today in the European trading session.
We have seen a bullish opening of the markets this week.
We can clearly see a bullish harami pattern above the $1152 handle which is a bullish pattern and signifies the end of a bearish phase and the start of a bullish phase in the markets.
ETH is now trading just above its pivot level of 1217 and moving into a mildly bullish channel. The price of ETHUSD is now testing its classic resistance level of 1221 and Fibonacci resistance level of 1224 after which the path towards 1300 will get cleared.
The relative strength index is at 59 indicating a strong demand for Ether and the continuation of the bullish phase in the markets.
We can see the formation of bullish engulfing lines in the 4-hour time frame.
Both the STOCHRSI and Williams percent range are indicating an overbought market, which means that the prices are expected to decline in the short-term range.
Most of the technical indicators are giving a BUY market signal.
Most of the moving averages are giving a BUY signal and we are now looking at the levels of $1350 to $1400 in the short-term range.
ETH is now trading above its 100 & 200 hourly simple and exponential moving averages.
[*] Ether: bullish reversal seen above the $1152 mark
[*] Short-term range appears to be mildly bullish
[*] ETH continues to remain above the $1200 level
[*] The average true range is indicating LESS market volatility
Ether: Bullish Reversal Seen Above $1152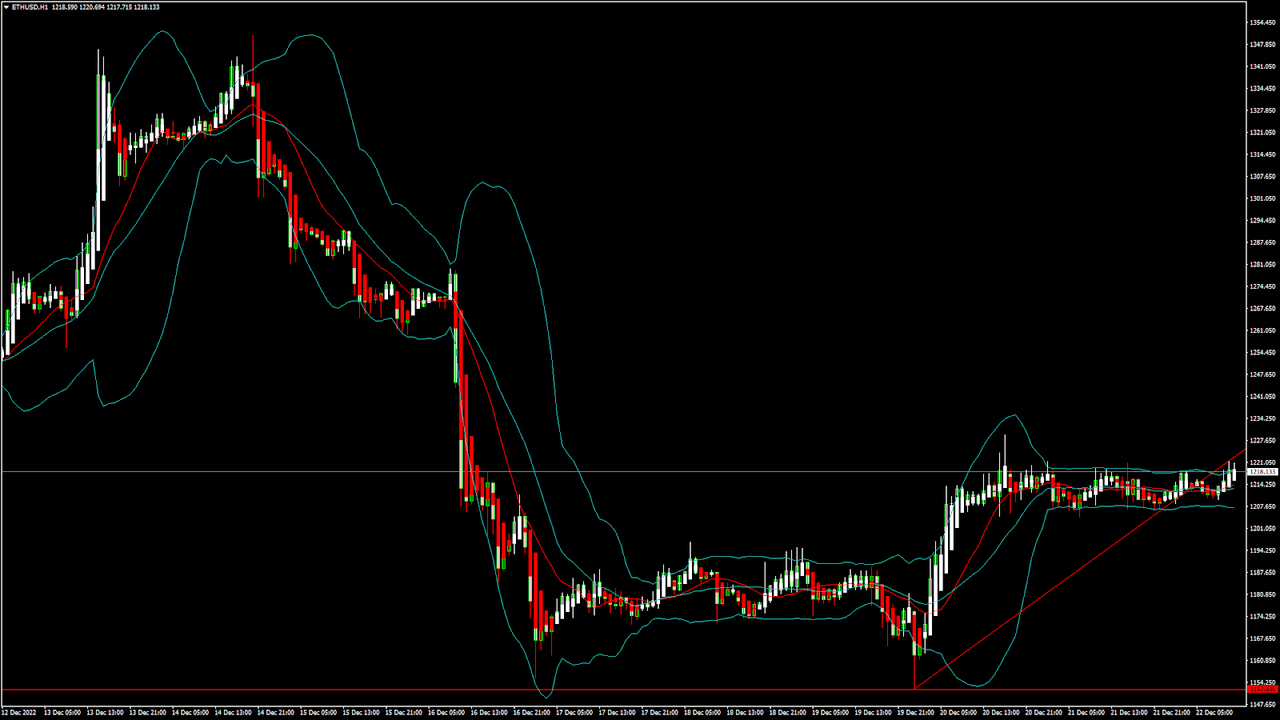
ETHUSD is now moving into a mildly bullish channel with the price trading above the $1200 handle in the European trading session today.
ETH touched an intraday low of 1209 in the Asian trading session and an intraday high of 1220 in the European trading session today.
We can see that the price is back over the pivot point in the 4-hour time frame.
The parabolic SAR indicator is giving a bullish reversal signal in the 2-hour time frame.
The Ichimoku price is over the cloud in the 2-hour time frame indicating a bullish tone of the markets.
The price of Ethereum is marching towards a bullish zone against the US dollar and bitcoin. ETH/USD could continue to move higher back towards the $1400 level.
The daily RSI is printing at 47 indicating a NEUTRAL demand for Ether in the medium-term range.
The key support levels to watch are $1184 which is a 3-10 day MACD oscillator stalls, and $1191 which is a 14-3 day raw stochastic at 20%.
ETH has increased by 0.20% with a price change of 2.43$ in the past 24hrs and has a trading volume of 37.617 billion USD.
We can see a decrease of 29.77% in the total trading volume in the last 24 hrs which appears to be normal.
The Week Ahead
ETH’s price continues to remain in a bullish zone against the US dollar and bitcoin. ETHUSD is expected to move higher towards the $1300 and $1400 levels this week.
On the upside we are now looking at the immediate targets of 1303 which is a 38.2% retracement from a 13-week low, and 1372 which is a 50% retracement from 13-week high/low.
The immediate short-term outlook for Ether has turned mildly bullish, the medium-term outlook has turned neutral, and the long-term outlook for Ether is neutral in present market conditions.
The price of ETHUSD will need to remain above the important support level of $1172 at which the price crosses 18-day moving average stalls.
The weekly outlook is projected at $1450 with a consolidation zone of $1350.
Technical Indicators:
The average directional index, ADX (14): is at 33.73 indicating a BUY
The rate of price change: is at 0.694 indicating a BUY
Bull/bear power (13): is at 9.48 indicating a BUY
High/lows (14): is at 2.49 indicating a BUY
VIEW FULL ANALYSIS VISIT - FXOpen Blog...
Disclaimer: This forecast represents FXOpen Companies opinion only, it should not be construed as an offer, invitation or recommendation in respect to FXOpen Companies products and services or as financial advice.
AUD/USD and NZD/USD Could Struggle To Recover Losses
[I]AUD/USD declined below the 0.6750 and 0.6720 support levels. NZD/USD also declined towards 0.6230 and is currently attempting a recovery wave.[/i]
Important Takeaways for AUD/USD and NZD/USD
[*] The Aussie Dollar started a fresh decline from well above the 0.6800 level against the US Dollar.
[*] There was a break below a connecting bullish trend line with support near 0.6720 on the hourly chart of AUD/USD.
[*] NZD/USD declined heavily below the 0.6350 support zone and tested 0.6230.
[*] There is a major bearish trend line forming with resistance near 0.6295 on the hourly chart of NZD/USD.
AUD/USD Technical Analysis
The Aussie Dollar started a fresh decline from the 0.6800 zone against the US Dollar. The AUD/USD pair remained in a bearish zone below the 0.6750 level.
There was a clear move below the 0.6720 support and the 50 hourly simple moving average. Besides, there was a break below a connecting bullish trend line with support near 0.6720 on the hourly chart of AUD/USD.
AUD/USD Hourly Chart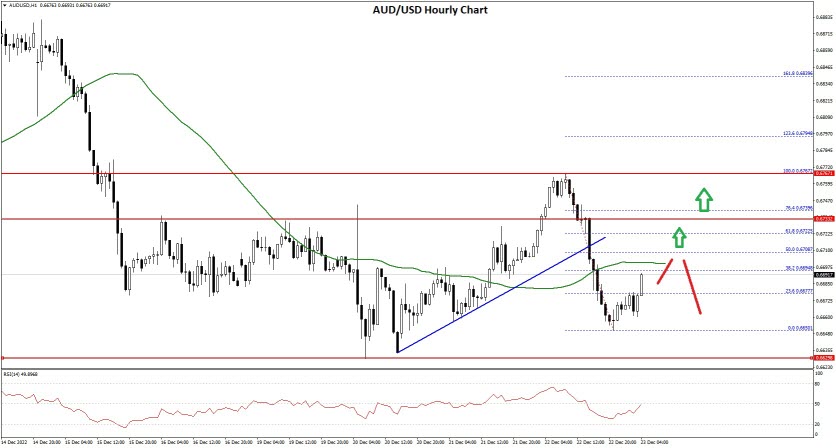
The pair traded as low as 0.6650 FXOpen and is currently correcting higher. It surpassed the 23.6% Fib retracement level of the downward move from the 0.6767 swing high to 0.6650 low.
On the upside, the AUD/USD pair is facing resistance near the 0.6700 level and the 50 hourly simple moving average. The next major resistance is near the 0.6710 level. It is near the 50% Fib retracement level of the downward move from the 0.6767 swing high to 0.6650 low.
A close above the 0.6710 level could start another steady increase in the near term. The next major resistance could be 0.6765.
On the downside, an initial support is near the 0.6650 level. The next support could be the 0.6620 level. If there is a downside break below the 0.6620 support, the pair could extend its decline towards the 0.6580 level. Any more losses might send the pair towards the 0.6550 support.
VIEW FULL ANALYSIS VISIT - FXOpen Blog...
Disclaimer: This forecast represents FXOpen Companies opinion only, it should not be construed as an offer, invitation or recommendation in respect to FXOpen Companies products and services or as financial advice.
FXOpen 2022 Market Year Wrap With Gary Thomson
The turbulent trading year of 2022 is soon coming to an end, therefore FXOpen UK COO Gary Thomson has taken the chance to reflect on the major market events of the year. Watch now!
[*] Meta Platforms’ stock price dived in February
[*] Russia Invaded Ukraine
[*] USD/JPY Bullish Breakout
[*] Federal Reserve Delivers the Biggest Rate Hike Since 2000
[*] The UK Mini-Budget Sent the Pound Lower in September
[*] EUR/USD Dropped Below Parity
[*] US Midterm Elections Were a Concern
[*] US Stocks Bottomed in October But Remain Negative on the Year
[*] US Tech Sector Announced Major Layoffs in November
Watch our short and informative video and stay updated with FXOpen.
FXOpen YouTube
Disclaimer: This forecast represents FXOpen Companies opinion only, it should not be construed as an offer, invitation or recommendation in respect to FXOpen Companies products and services or as financial advice.