Daily Market Analysis By FXOpen
EUR/USD and EUR/JPY Could Climb Further Higher
EUR/USD is slowly moving higher above 0.9800. EUR/JPY is also rising and might climb further higher above the 147.25 zone.
Important Takeaways for EUR/USD and EUR/JPY
[*] The Euro started a recovery wave and was able to clear the 0.9800 resistance zone.
[*] There is a key bullish trend line forming with support near 0.9835 on the hourly chart.
[*] EUR/JPY started a strong increase and settled well above the 145.50 zone.
[*] There is a major bullish trend line forming with support near 146.90 on the hourly chart.
EUR/USD Technical Analysis
The Euro formed a base above the 0.9660 zone and started recovery wave against the US Dollar. The EUR/USD pair was able to clear the 0.9720 and 0.9750 resistance levels.
There was a clear move above the 0.9800 level and the 50 hourly simple moving average. The pair even climbed above 0.9850 and traded as high as 0.9875 on FXOpen. It is now consolidating gains near the 0.9850 zone.
EUR/USD Hourly Chart
On the downside, the pair might find support near the 0.9835 level. Besides, there is a key bullish trend line forming with support near 0.9835 on the hourly chart. The trend line is near the 23.6% Fib retracement level of the upward move from the 0.9702 swing low to 0.9875 high.
The next major support sits near the 0.9810 level and the 50 hourly simple moving average, below which the pair could even test the 50% Fib retracement level of the upward move from the 0.9702 swing low to 0.9875 high.
If there is a downside break below the 0.9790 support, the pair might accelerate lower in the coming sessions. In the stated case, it could even test 0.9720.
On the upside, an immediate resistance is near the 0.9885 level. The next major resistance is near the 0.9920 level. The first major resistance is near the 0.9950 level. A clear move above the 0.9950 resistance might send the price towards 1.0000. If the bulls remain in action, the pair could revisit the 1.0050 resistance zone in the near term.
VIEW FULL ANALYSIS VISIT - FXOpen Blog...
Disclaimer: CFDs are complex instruments and come with a high risk of losing your money.
UK inflation officially goes over 10%
During the last year in which many Western nations have experienced high levels of inflation, there have been official figures which have been relatively conservative estimates, and unofficial figures which have suggested that inflation in the United States and Britain has been into double digits for quite some time.
It is, however, the official figures which tend to have an impact on the currency and stock markets, therefore today's revelation that the British economy has begun to experience 10.1% inflation is of great interest.
The news channels this morning were quick to highlight the inflation level going over the 10% threshold, however very little effect has been shown with relation to the value of the British Pound against the Euro or US Dollar.
This is perhaps because the anticipation has been steadily building over time, hence this is perhaps not a surprise, and generally it is surprises that tend to create sudden volatility in the financial markets.
What it does depict is that double digit levels of inflation in the UK have been reached, and this is not a good sign for the economy which continues to decline. The British Pound today remains at around 1.12 against the US Dollar, continuing its low value which, despite a few small movements upwards over recent days, represents a steady decline over the past weeks which followed a long period of rapid depreciation.
What we perhaps can learn is that despite the new Chancellor of the Exchequer Jeremy Hunt having almost completely reversed the mini-budget issued by recently installed Prime Minister Liz Truss, a clear sign of an unstable government and a weakening economy, the Pound has not suddenly crashed to even lower levels.
Perhaps it has bottomed out, or investors and traders have understood that the declining economy and suddenly unstable government in a usually extremely stable and calm nation is now a relatively long term matter, and that the state of the economy is now somehow measurable.
Therefore, despite the sensationalist headlines, the value of the Pound against its Western major peers is a case of business as usual.
VIEW FULL ANALYSIS VISIT - FXOpen Blog...
Disclaimer: CFDs are complex instruments and come with a high risk of losing your money.
ETHUSD and LTCUSD Technical Analysis – 20th OCT, 2022
ETHUSD: Bullish Harami Pattern Above $1263
Ethereum was unable to sustain its bearish momentum and after touching a low of 1205 on 13th Oct, the price started to correct upwards against the US dollar. The price of Ethereum touched a high of 1342 on 14th Oct after which we can see a shift towards the consolidation phase in the markets.
We have seen a bullish opening of the markets which indicates the present bullish trend.
We can clearly see a bullish harami pattern above the $1263 handle which signifies the end of a bearish phase and the start of a bullish phase in the markets.
ETH is now trading just above its pivot level of 1291 and moving into a mildly bullish channel. The price of ETHUSD is now testing its classic resistance level of 1294 and Fibonacci resistance level of 1296 after which the path towards 1300 will get cleared.
The relative strength index is at 47 indicating a neutral demand for Ether and a shift towards consolidation phase in the markets.
We can see that the Williams percent range is back over -50 indicating the bullish tone present in the markets.
The STOCHRSI is indicating an overbought market, which means that the price is expected to decline in the short-term range.
Some of the technical indicators are giving a STRONG BUY market signal.
Some of the moving averages are giving a BUY signal and we are now looking at the levels of $1350 to $1400 in the short-term range.
ETH is now trading below both the 100 & 200 hourly simple and exponential moving averages.
[*] Short-term range appears to be mildly bullish
[*] ETH continues to remain above the $1200 level
[*] The average true range is indicating LESS market volatility
Ether: Bullish Reversal Seen Above $1263

ETHUSD is now moving into a mildly bullish channel with the price trading above the $1200 handle in the European trading session today.
ETH touched an intraday low of 1271 in the Asian trading session and an intraday high of 1294 in the European trading session today.
We can see the formation of a bullish harami pattern in the weekly time frame.
The commodity channel index is indicating a neutral level and fresh upsides are expected in the markets towards the 1300 handle.
Ethereum’s price continues to move into a bullish zone against the US dollar and is expected to move above the $1300 levels.
The daily RSI is printing at 43 indicating a weak demand in the long-term range.
The key support levels to watch are $1232 and $1251, and the price of ETHUSD needs to remain above these levels for the continuation of the bullish reversal in the markets.
ETH has decreased by 0.40% with a price change of 5.16$ in the past 24hrs and has a trading volume of 8.465 billion USD.
We can see a decrease of 15.87% in the total trading volume in the last 24 hrs which appears to be normal.
The Week Ahead
The price of Ethereum continues to remain well supported above the $1200 level, and has now started to move higher aiming at the $1300 level.
We can see the formation of a major bullish trend line in place from $1263 towards $1359 levels.
The immediate short-term outlook for Ether has turned mildly bullish, the medium-term outlook has turned neutral, and the long-term outlook for Ether is neutral in present market conditions.
The price of ETHUSD will need to remain above the important support level of $1273 which is a 38.2% retracement from 4-week low.
The weekly outlook is projected at $1400 with a consolidation zone of $1375.
Technical Indicators:
The average directional index ADX (14): is at 35.00 indicating a BUY
The ultimate oscillator: is at 69.59 indicating a BUY
Bull/bear power (13): is at 3.83 indicating a BUY
The commodity channel index (14): is at 59.91 indicating a BUY
VIEW FULL ANALYSIS VISIT - FXOpen Blog...
VIEW FULL ANALYSIS VISIT - FXOpen Blog...
Disclaimer: CFDs are complex instruments and come with a high risk of losing your money.
Gold Price Drops While Crude Oil Price Aims Fresh Increase
Gold price started a fresh decline and traded below $1,650. Crude oil price is holding the $84.25 support and might start a fresh increase.
Important Takeaways for Gold and Oil
[*] Gold price failed to surpass $1,680 and started a fresh decline against the US Dollar.
[*] There is a key bearish trend line forming with resistance near $1,638 on the hourly chart of gold.
[*] Crude oil price is showing positive signs above the $84.25 support zone.
[*] There is a major bullish trend line forming with support near $83.80 on the hourly chart of XTI/USD.
Gold Price Technical Analysis
Gold price failed to gain strength for a move above the $1,680 resistance against the US Dollar. The price started a fresh decline and traded below the $1,650 support level.
There was a clear move below the $1,640 support zone and the 50 hourly simple moving average. The price traded as low as $1,622 on FXOpen and recently there was a recovery wave. The price was able to clear the $1,630 resistance zone.
However, the price failed to clear $1,645 and started another decline. It traded below the 50% Fib retracement level of the upward move from the $1,622 swing low to $1,645 high.
It is now trading below the $1,630 level. There was also a move below the 76.4% Fib retracement level of the upward move from the $1,622 swing low to $1,645 high. An immediate support on the downside is near the $1,622 level.
The next major support is near the $1,620 level, below which there is a risk of a larger decline. In the stated case, the price could decline sharply towards the $1,600 support zone.
On the upside, the price is facing resistance near the $1,635 level. The first major resistance is near the $1,638 level. There is also a key bearish trend line forming with resistance near $1,638 on the hourly chart of gold.
The main resistance is now forming near the $1,645 level, above which it could even test $1,650. A clear upside break above the $1,650 resistance could send the price towards $1,680.
VIEW FULL ANALYSIS VISIT - FXOpen Blog...
Disclaimer: CFDs are complex instruments and come with a high risk of losing your money.
Watch FXOpen's October 17-21 Weekly Market Wrap Video
In this video, FXOpen UK COO Gary Thomson sums up the week’s happenings and discusses the most significant news reports.
[*] Semiconductor war between China and the US
[*] The US puts pressure on the price of oil
[*] UK inflation officially goes over 10%
[*] How UK’s political drama is affecting financial markets
Watch our short and informative video, and stay updated with FXOpen.
FXOpen YouTube
Disclaimer: CFDs are complex instruments and come with a high risk of losing your money.
GBP/USD Gains Momentum, EUR/GBP Eyes Fresh Increase
GBP/USD started a recovery wave and climbed above the 1.1300 resistance. EUR/GBP is trading above the 0.8650 support and might eye a fresh increase.
Important Takeaways for GBP/USD and EUR/GBP[/\b]
[*] The British Pound started a fresh increase after it broke the 1.1250 resistance against the US Dollar.
[*] There was a break above a major bearish trend line at 1.1290 on the hourly chart of GBP/USD.
[*] EUR/GBP started a downside correction after it failed to clear the 0.8780 zone.
[*] There was a break below a contracting triangle with support near 0.8720 on the hourly chart.
GBP/USD Technical Analysis
The British Pound found support near the 1.1050 zone against the US Dollar. The GBP/USD pair started a recovery wave and was able to clear the 1.1150 resistance zone.
There was a decent increase above the 1.1250 level and the 50 hourly simple moving average. The pair even climbed above the 1.1300 level. During the increase, there was a break above a major bearish trend line at 1.1290 on the hourly chart of GBP/USD.
[b]GBP/USD Hourly Chart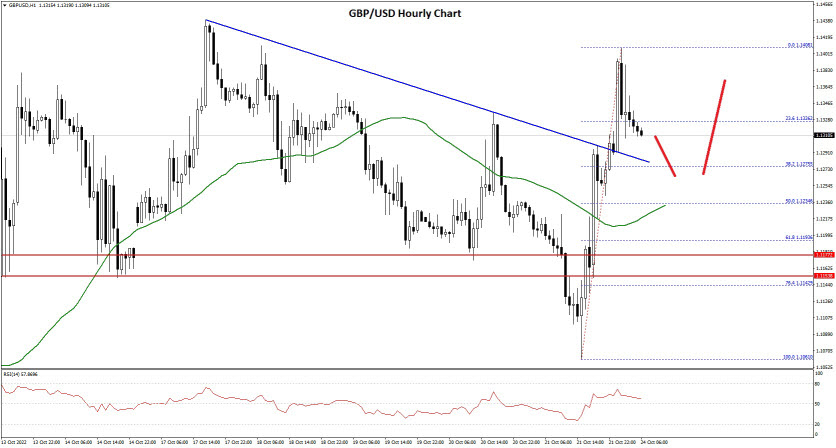
A high was formed near 1.1408 on FXOpen and the pair is now correcting gains. On the downside, an initial support is near the 1.1280 level. It is near the 38.2% Fib retracement level of the upward move from the 1.1061 swing low to 1.1408 high.
The next major support is near the 1.1235 level and the 50 hourly simple moving average. It is near the 50% Fib retracement level of the upward move from the 1.1061 swing low to 1.1408 high. Any more losses could lead the pair towards the 1.1180 support zone or even 1.1150.
On the upside, an initial resistance is near the 1.1350 level. The next main resistance is near the 1.1400 zone. A clear upside break above the 1.1400 and 1.1410 resistance levels could open the doors for a steady increase in the near term. The next major resistance sits near the 1.1500 level.
VIEW FULL ANALYSIS VISIT - FXOpen Blog...
Disclaimer: CFDs are complex instruments and come with a high risk of losing your money.
Currency roller coaster continues as GBP see-saws on Boris Johnson exit
The famous British sense of humor has made its presence felt at a time of despair once again, with pictures circulating the internet of 10 Downing Street, the Prime Minister's residence, with a revolving door superimposed instead of its famous black wooden effort.
This symbolizes the unusually short periods in office held by premiers that are being perceived by the public in an ordinarily utterly stable country.
Since Liz Truss left office after just 44 days as Prime Minister following Boris Johnson's dishonorable exit from office, her only legacy being a disastrous budget which temporary chancellor Jeremy Hunt reversed, the continual downward movement of the British Pound against the Euro and US Dollar that has been evident for many months turned into volatility as a result of suspense and uncertainty.
Over the months which led to the end of Boris Johnson's premiership, the British economy tanked and the Pound devalued consistently, and suddenly dived further when Liz Truss took office.
When she left, Boris Johnson resurfaced, claiming that he was eligible to return to office, with 102 votes in favor of his re-appointment as Prime Minister.
Late last night, however, Mr. Johnson announced that he would not be returning to office.
This changing set of events has caused the British Pound to 'see-saw' in value, gaining as much as 0.9% to hit a high of $1.1401, before paring gains to be up about 0.4% at $1.134.
Britain's credit rating has been affected by the political misadventures that have led the country to economic crisis, and the apparent instability of the current government. Moody's, a respected global credit and referencing agency, has downgraded the UK's outlook from 'stable' to 'negative'.
Gilt and sterling markets were turbulent towards the end of last week as investors considered the leadership race, and whilst Mr. Johnson claimed he had 102 votes, opponents expressed their doubt that he had more than 50.
All the while, it is important to note that the UK has had a new head of state, King Charles, and an entire new government, and now potentially two new Prime Ministers, all having taken place without one single free vote being cast by the public.
With the Pound so volatile and the economy in disarray, the markets are responding appropriately - with caution - and therefore volatility is abound whenever yet another twist or turn takes place.
VIEW FULL ANALYSIS VISIT - FXOpen Blog...
Disclaimer: CFDs are complex instruments and come with a high risk of losing your money.
BTCUSD and XRPUSD Technical Analysis – 25th OCT 2022
BTCUSD: Bearish Engulfing Pattern Below $19685
Bitcoin was unable to sustain its bullish momentum and after touching a high of 19694 on 18th Oct, it started to decline touching a low of 18718 on 21st Oct.
We can see that bitcoin has made a failed attempt to cross the $20500 resistance on two separate occasions this month and is now back in the bearish zone.
We can see the formation of a bearish price crossover pattern with adaptive moving average AMA 20 and AMA 100 in the 4-hour time frame.
We can clearly see a bearish engulfing pattern below the $19685 handle which is a bearish reversal pattern because it signifies the end of an uptrend and a shift towards a downtrend.
Bitcoin touched an intraday low of 19252 in the Asian trading session and an intraday high of 19372 in the European trading session today.
Both the STOCH and Williams percent range are indicating overbought levels which means that in the immediate short term, a decline in the prices is expected.
The relative strength index is at 44 indicating a WEAKER demand for bitcoin, and the continuation of the selling pressure in the markets.
Bitcoin is now moving above its 100 hourly simple moving average and above its 200 hourly exponential moving averages.
Some of the major technical indicators are giving a SELL signal, which means that in the immediate short term, we are expecting targets of 19000 and 18500.
The average true range is indicating LESS market volatility with a mildly bearish momentum.
[*] Bitcoin: bearish reversal seen below $19685
[*] The STOCHRSI is indicating an oversold level
[*] The price is now trading just below its pivot level of $19355
[*] Some of the moving averages are giving a SELL market signal
Bitcoin: Bearish Reversal Seen Below $19685
We can now see the progression of a falling trend channel in bitcoin as it is unable to hold onto its gains, and the increase in the selling pressure suggest we are now moving towards the $18000 handle.
The Aroon indicator is giving a bearish trend signal in the 1-hour time frame.
The MACD indicator is back under zero indicating the bearish trend in the 15-minute time frame.
The RSI indicator is also back under 50 indicating the weakness present in the markets.
The immediate short-term outlook for bitcoin is mildly bearish, the medium-term outlook has turned bearish, and the long-term outlook remains neutral under present market conditions.
Bitcoin’s support zone is located at $18577, the Camarilla support levels and the price needs to remain above this level for any potential of the bullish reversal in the markets.
The price of BTCUSD is now facing its classic support level of 19303 and Fibonacci resistance level of 19343 after which the path towards 18500 will get cleared.
In the last 24hrs, BTCUSD has decreased by 0.03% by 5$ and has a 24hr trading volume of USD 26.294 billion. We can see a decrease of 4.13% in the trading volume compared to yesterday, which appears to be normal.
The Week Ahead
The price of bitcoin is moving in a mildly bearish zone below the $19500 level. Further downside is projected at $18500 and $18000 as the immediate targets.
We have seen a bearish opening of the markets which suggests that we are poised for further declines this week below the $19000 levels.
The daily RSI is printing at 48 which indicates a neutral level and a move towards the consolidation phase in the markets.
The price of BTCUSD will need to remain above the important support level of $18000 this week.
The weekly outlook is projected at $18500 with a consolidation zone of $18000.
Technical Indicators:
The moving Averages Convergence Divergence MACD (12,26): is at -5.20 indicating a SELL
The commodity channel index CCI (14): is at -80.22 indicating a SELL
The rate of price change ROC: is at -0.16 indicating a SELL
The bull/bear power (13): is at 3-38.49 indicating a SELL
VIEW FULL ANALYSIS VISIT - FXOpen Blog...
Disclaimer: CFDs are complex instruments and come with a high risk of losing your money.
EUR/USD Gathers Pace, USD/JPY Dips Below 150
EUR/USD started a steady increase above the 0.9900 resistance zone. USD/JPY started a downside correction from the 152.00 resistance zone.
Important Takeaways for EUR/USD and USD/JPY
[*] The Euro formed a base and started a decent upward move above the 0.9850 zone.
[*] There is a major bullish trend line forming with support near 0.9910 on the hourly chart of EUR/USD.
[*] USD/JPY declined sharply after it surged to a new multi-year high at 151.94.
[*] There was a break below a key bullish trend line with support near 150.40 on the hourly chart.
EUR/USD Technical Analysis
This past week, the Euro found support near the 0.9700 zone against the US Dollar. The EUR/USD pair started a steady upward move above the 0.9800 and 0.9820 resistance levels.
There was a key increase above the 0.9900 resistance zone and the 50 hourly simple moving average. The pair even climbed above the 0.9950 resistance zone. A high was formed near 0.9977 on FXOpen and the pair is now consolidating gains.
EUR/USD Hourly Chart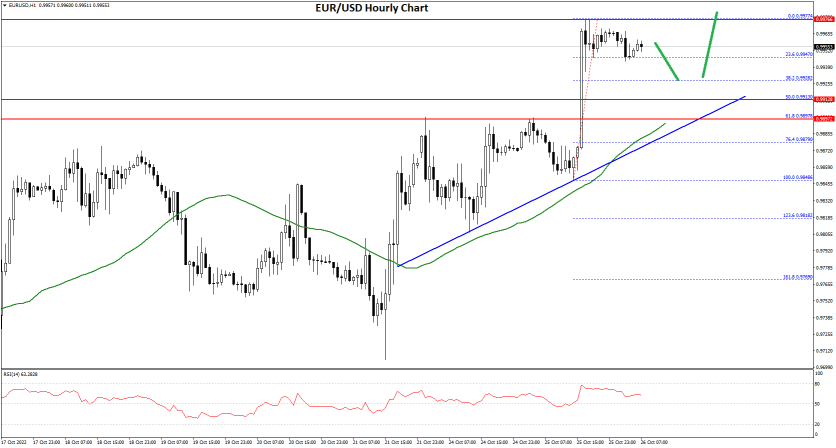
An initial support on the downside is near the 0.9950 level. It is near the 23.6% Fib retracement level of the upward move from the 0.9848 swing low to 0.9977 high.
The first major support is near the 0.9920 level. There is also a major bullish trend line forming with support near 0.9910 on the hourly chart of EUR/USD. The main support sits near the 0.9910 zone. It is near the 50% Fib retracement level of the upward move from the 0.9848 swing low to 0.9977 high.
An immediate resistance on the upside is near the 0.9980 level. The next major resistance is near the 1.0000 level. An upside break above 1.0000 could set the pace for another increase. In the stated case, the pair might revisit 1.0120. Any more gains might send the pair towards 1.0200.
VIEW FULL ANALYSIS VISIT - FXOpen Blog...
Disclaimer: CFDs are complex instruments and come with a high risk of losing your money.
Big Tech hit by fears of potential recession
Last year, there was a huge amount of caution around the US Big Tech stocks, many of which demonstrated considerable levels of volatility on New York's premier stock exchanges.
There were several periods in which stocks in some of the most well recognized publicly listed technology firms decreased in value tremendously.
That has all gone relatively quiet, especially in the light of the current volatility in the currency markets as the US Dollar remarkably holds its strength over a weak Pound.
Today, however, the US big tech stock debacle has come to light again, with Microsoft and Alphabet (Google) having reported that they have experienced downturns in sales, which adds further weight to the speculation that the Western economy in general is looking at further downturns.
Alphabet (Google) has been cutting its advertising budget, and the resultant 6% rise in sales in the 3 months neding September 30 this year is a damp squib. In fact, this is the slowest quarterly growth since before March 2020 for Alphabet.
Microsoft has also stated that demand for its hardware and software has weakened over the same period, with sales having increased by 11% to $50.1bn, marking its slowest revenue growth in five years.
Costs for US tech giants have been a major stumbling block recently, as the strong US Dollar against depreciating majors in Europe and Japan have resulted in a very high cost of doing business overseas.
Profits at Alphabet dropped nearly 30% to $13.9bn in the quarter, as YouTube (also owned by Alphabet alongside Google) advertising revenues declined for the first time since the firm started to report them publicly.
Interestingly, Microsoft stock has been doing well until this announcement came to light. It is currently at 1.38% over its close yesterday, and up 5.76% over the five day average, however there is a prediction by Google Finance that it may not hold that way.
It's a similar story for Alphabet (Google) stock which closed 1.9% up over yesterday's close, with a prediction of some volatility ahead.
Time will tell of course, however these figures are being considered by many news sources as a marker of weak performance and therefore have led to cautiousness in the markets.
Buy or sell shares with CFDs in some of the world's biggest publicly listed companies on FXOpen’s trading platform. Open your FXOpen account now or learn more about making your money go further with FXOpen.
VIEW FULL ANALYSIS VISIT - FXOpen Blog...
Disclaimer: CFDs are complex instruments and come with a high risk of losing your money.