You are currently not signed in.

Please sign in or register.

Signal_Bars Indicator

Página: 1 2 >
Dec 29, 2012 09:41 am
#1
ironical User

Postagens: 734
Membro desde: 22/04/2011

This indicator is really useful.

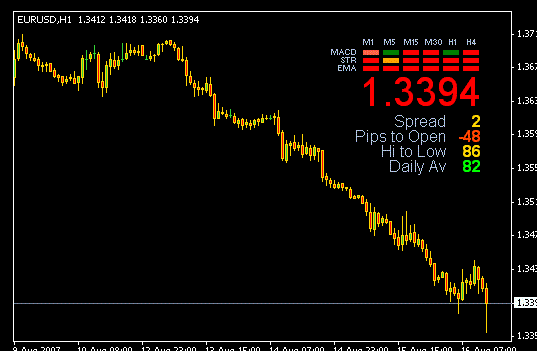
It shows levels of EMA, STR and MACD od multiple timeframes. It also shows current price and spread.

Check it out and give ur feedback

The good or ill of a man lies within his own will. – Epictetus

Dec 31, 2012 06:51 am
Sasha User

Postagens: 836
Membro desde: 16/05/2011

Originally posted by ironical

This indicator is really useful.

It shows levels of EMA, STR and MACD od multiple timeframes. It also shows current price and spread.

Check it out and give ur feedback


Nice sharing. I think adding a screenshot of this indicator would help users.

Jan 01, 2013 06:04 am
illiterate User

Postagens: 561
Membro desde: 21/04/2011

Thx for sharing it with us. 

Sasha is right about screenshot. I will try putting one but I think screen shot with the top thread is better.

https://www.fxstat.com/widget/link?t=medium&c=1&s=25892&o1=growth&o2=drawdown&o3=monthly&o4=equity

Jan 03, 2013 06:42 am
Jogi User

Postagens: 685
Membro desde: 06/06/2011

wow. it shows 2 of my fav indicators (EMA and MACD). What does it mean by "on different timeframes"? Do u mean that it will automatically show levels of indicators on 1 chart for multiple timeframes? How is it possible?
http://www.fxstat.com/widget/link?t=wide&c=1&s=26883&o1=growth&o2=drawdown&o3=monthly&o4=equity

Jan 04, 2013 07:09 am
Champ User

Postagens: 711
Membro desde: 17/05/2011

Originally posted by Jogi

wow. it shows 2 of my fav indicators (EMA and MACD). What does it mean by "on different timeframes"? Do u mean that it will automatically show levels of indicators on 1 chart for multiple timeframes? How is it possible?


I think it will show values or levels or maybe some kind of up and down indication on single chart. Looks to be a good indicator.

http://www.fxstat.com/widget/link?t=tiny&c=1&s=24959&o1=growth&o2=drawdown&o3=profitfactor

Jan 05, 2013 10:30 am

Postagens: 939
Membro desde: 21/04/2011

Originally posted by Champ


Originally posted by Jogi


wow. it shows 2 of my fav indicators (EMA and MACD). What does it mean by "on different timeframes"? Do u mean that it will automatically show levels of indicators on 1 chart for multiple timeframes? How is it possible?


I think it will show values or levels or maybe some kind of up and down indication on single chart. Looks to be a good indicator.


I have read about it in past. It gives u indication in the form of red and green bars. That is why it is named as Signal_Bars indicator. It is good if u r using macd, rsi and str in ur technical analysis.

Stick to your rules

Jan 08, 2013 03:19 am
Champ User

Postagens: 711
Membro desde: 17/05/2011

I found an image of signal bars indicator. See if it helps u.

http://www.fxstat.com/widget/link?t=tiny&c=1&s=24959&o1=growth&o2=drawdown&o3=profitfactor

Attachements:


Jan 09, 2013 04:43 am
Jogi User

Postagens: 685
Membro desde: 06/06/2011

Originally posted by Champ

I found an image of signal bars indicator. See if it helps u.


Thx a lot buddy. It would be of great help for everyone.

Indicator looks good and worth trying.

http://www.fxstat.com/widget/link?t=wide&c=1&s=26883&o1=growth&o2=drawdown&o3=monthly&o4=equity

Jan 12, 2013 02:37 pm
Champ User

Postagens: 711
Membro desde: 17/05/2011

Thx a lot buddy. It would be of great help for everyone.

Indicator looks good and worth trying.


Definitely. It gives some useful information on one screen. 

http://www.fxstat.com/widget/link?t=tiny&c=1&s=24959&o1=growth&o2=drawdown&o3=profitfactor

Jan 14, 2013 01:35 pm
ironical User

Postagens: 734
Membro desde: 22/04/2011

Originally posted by Champ

I found an image of signal bars indicator. See if it helps u.


thx for sharing. What is this "pips to open". Is it some kind of forecast which tells about pips to open?

The good or ill of a man lies within his own will. – Epictetus

Feb 09, 2013 09:38 am

Postagens: 5
Membro desde: 07/02/2013

What does it mean by "on different timeframes"?

Do u mean that it will automatically show levels of indicators on

1 chart for multiple timeframes? How is it possible?

Página: 1 2 >