Daily Market Analysis By FXOpen
The Roaring 20s! How trading the markets has advanced in just a few years
The 2020s is an exciting time to be trading the global markets.
In the previous decade, the electronic markets went through a revolutionary period. We witnessed the invention and uprising of cryptocurrencies, the 'influencer' generation beginning to move into the financial markets with memes and internet-based trends, and we saw the entire existing framework change in dramatic restructures in the trading methods of financial products traded on the electronic markets in the wake of the 2008/2009 financial crises.
European and American authorities began to make major changes which have fomented the sustainability of the electronic derivatives trading markets where traditional asset classes such as Forex, commodities and equities are concerned, and a whole host of decentralized asset classes have joined them along the way.
As the last exciting decade of revolutionary technological and regulatory development came to an end, the 2020s became a period of limitless innovation, in which FinTech, cryptocurrency and multi-asset trading has been embraced.
Along with the community-driven cryptocurrency revolution and its entry into the mainstream, came various geopolitical milestones that are unprecedented.
Lockdowns, inflation and a volatile commodities market, as well as a myriad of new traders who had switched their ambitions from working for a company prior to the lockdowns to seeking their own financial independence from the convenience of their own laptop or smartphone by trading the markets. We have entered the age of the analytical, pragmatic and goal-orientated trader.
Despite the cryptocurrency revolution and the massive number of people getting involved in investing in Bitcoin, Ethereum and all manner of new native tokens that are now hot property, the commodities market is the hot topic of the decade, and to be more specific: Oil.
Just as the oil market is as traditional as the actual fossil fuel itself, the modern stock market is the absolute opposite! A new era has come about, born out of the minds of mavericks and entrepreneurs seeking to build a community-driven marketplace where influencers are beginning to become market makers in their own right.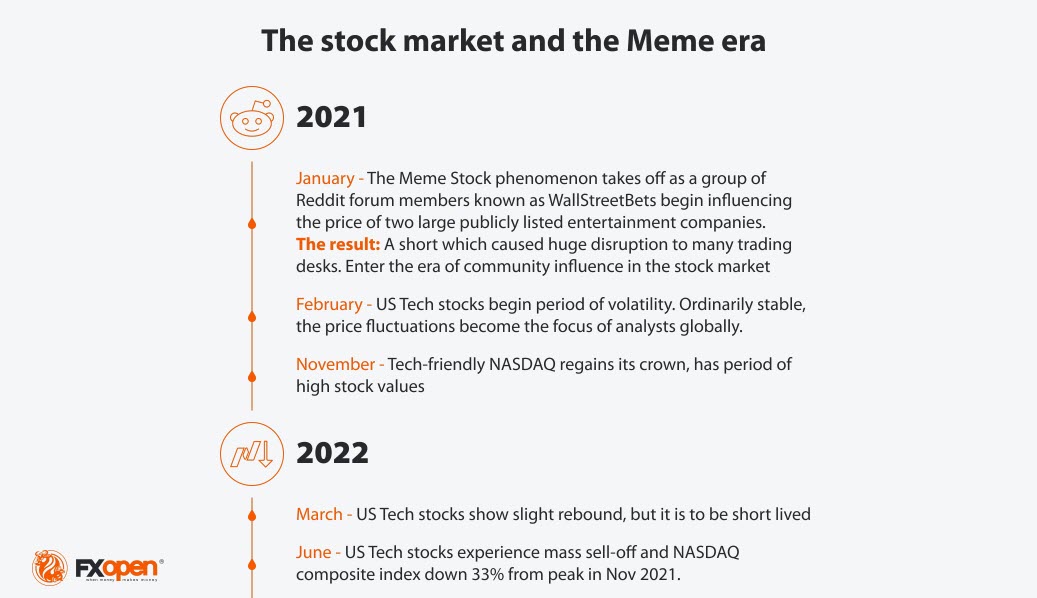
The ever-changing and ever increasingly innovative markets are at your fingertips. These are the times when your financial destiny is in your hands.
FXOpen Blog
BTCUSD and XRPUSD Technical Analysis – 09th AUG 2022
BTCUSD: Bullish Engulfing Pattern Above $22425
Bitcoin was unable to sustain its bearish momentum and after touching a low of 22431 on 04th Aug started to correct upwards against the US dollar crossing the $24000 handle on 08th Aug.
We can see that bitcoin failed to clear its resistance zone located at $25000 for the second time this month.
After touching a high of $24230 we can see some downwards correction in the prices towards the $23800 level.
We can clearly see a bullish engulfing pattern above the $22425 handle which is a bullish reversal pattern because it signifies the end of a downtrend and a shift towards an uptrend.
Bitcoin touched an intraday high of 23922 in the Asian trading session and an intraday low of 23639 in the Asian trading session today.
Both the STOCH and Williams percent range are indicating overbought levels which means that in the immediate short term, a decline in the prices is expected.
The relative strength index is at 50 indicating a NEUTRAL demand for bitcoin at the current market levels and the continuation of the consolidation phase in the markets.
Bitcoin is now moving above its 100 hourly simple moving average and its 200 hourly simple moving averages.
Some of the major technical indicators are giving a buy signal, which means that in the immediate short term, we are expecting targets of 24000 and 24500.
The average true range is indicating less market volatility with a mildly bullish momentum.
[*] Bitcoin: bullish reversal seen above $22425
[*] The STOCHRSI is indicating an oversold level
[*] The price is now trading just below its pivot levels of $23858
[*] Some of the moving averages are giving a buy market signal
Bitcoin: Bullish Reversal Seen Above $22425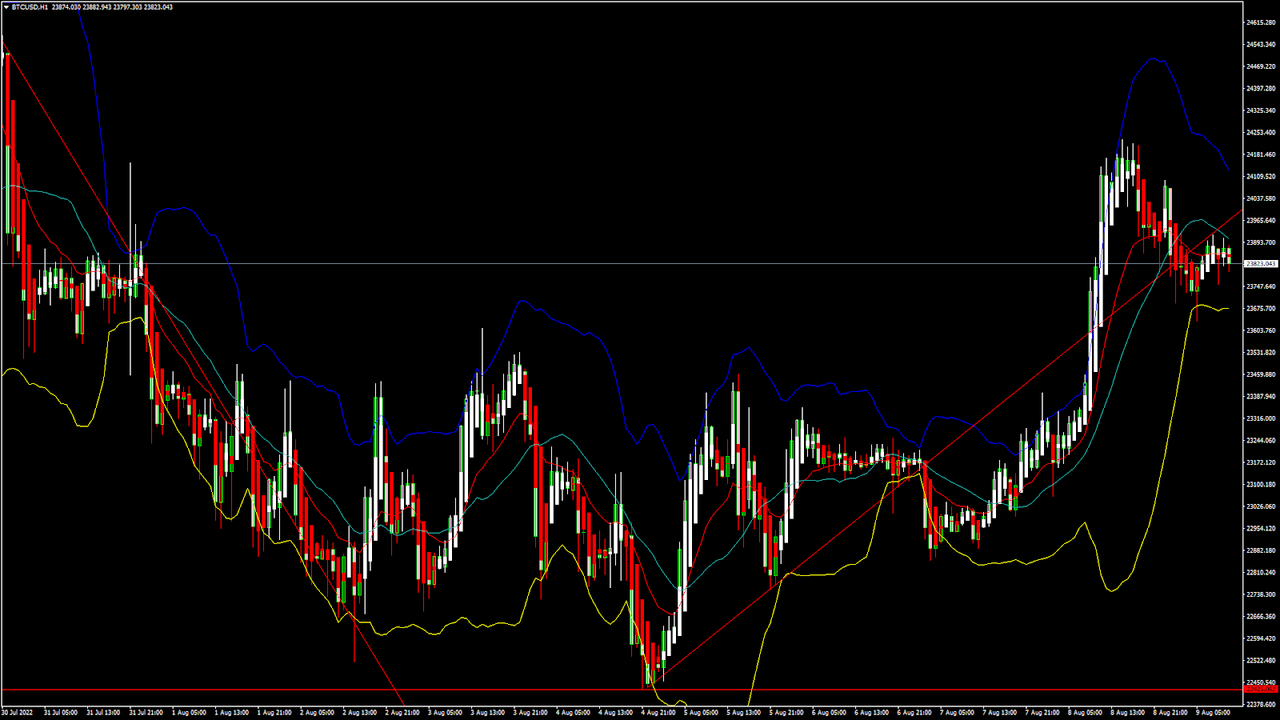
The price of bitcoin is struggling to move above the $24000 handle after it entered into a consolidation zone below the $24000 level.
The overall scenario of the markets is neutral at present; we will have to wait till some clear signals emerge for the medium-term range.
We can see that Ichimoku price is under the cloud in the 15-minute time frame indicating the underlying bearish nature of the markets.
The immediate short-term outlook for bitcoin is neutral; the medium-term outlook has turned neutral; and the long-term outlook remains neutral under present market conditions.
Bitcoin’s support zone is located at $22000 and the prices continue to remain above these levels for the continuation of the bullish reversal in the markets.
The price of BTCUSD is now facing its classic resistance level of 23899 and Fibonacci resistance level of 23932 after which the path towards 24000 will get cleared.
In the last 24hrs, BTCUSD has declined by 0.32% by 76$ and has a 24hr trading volume of USD 28.827 billion. We can see an increase of 50.20% in the trading volume as compared to yesterday, which is due to the buying seen by the short-term investors.
The Week Ahead
The price of bitcoin is moving in a consolidation zone under the $24000 level. The price is expected to remain moving into a narrow range between the $23000 and $24000 before any potential breakouts.
The daily RSI is printing at 59 which indicates a bullish market and the move towards the $25000 level.
The trendline formation is seen from the $22400 levels towards the $24000, and we are now looking for the continuation of this trend in the hourly time frame.
The price of BTCUSD will need to remain above the important support level of $22000 this week.
The weekly outlook is projected at $24000 with a consolidation zone of $23000.
Technical Indicators:
The average directional change (14 days): at 15.10 indicating a neutral
The ultimate oscillator: at 68.29 indicating a BUY
The relative strength index (14): at 52.53 indicating a neutral
The commodity channel index (14 days): at -19.17 indicating a neutral
VIEW FULL ANALYSIS VISIT - FXOpen Blog
Inflation in the UK: Cash withdrawals indicate faith in pound but not in economy
Throughout post-industrial history, when economic woes are abound, a large proportion of the public tend to revert to reliance on carrying items of physical value.
For the past two years, national economies in many Western nations have been turned on their heads, and faith in the traditional economic system has waned dramatically.
During times of rising inflation, it has been common for many people to invest in physical commodities such as gold, and to keep liquid assets at home or on their person.
Throughout many periods in the 20th century, that has been the case. The Great Depression which began in the late 1920s in the United States, the aftermath of World War Two in Europe, and the end of the Cold War in the late 1980s are three notable examples.
During those events, people who had a lot to lose generally bought gold and kept it in a safe place, often under their homes or in the walls.
The long period of stability which ensued has not necessitated such action, however these days, there are many geopolitical events that have once again generated a wave of instability, and have caused a once-trusting population to distrust the government and the system in many countries worldwide.
Inflation which is at 40-year highs in parts of Europe and the United States, along with forced closures of businesses, interruption of supply chains and siding with Ukraine which has caused havoc on the energy markets and cast doubt into the minds of citizens that their own governments actually represent their wellbeing has brought into being an overall level of self-reliance and movement away from trust in the existing economic structure.
The British Pound and its standing as a store of value is very interesting over recent times.
For over 50 years, no currency in the world has been backed by commodities, therefore it has been rare for any currency to be used as a store of value in times of economic uncertainty, but the British Pound is showing signs of being used as exactly that!
The Post Office, which offers banking services as well as mail has recorded a significant upturn in the number of cash withdrawals recently.
It is possible to withdraw cash from any bank account held with any bank via the Post Office, and therefore this is a good measure of the overall behavior of the public with regard to withdrawals of cash.
Britain’s Post Office, which offers banking services as well as mail, handled a record £801 million ($967 million) in personal cash withdrawals in July.
In total, more than £3.3 billion in cash was withdrawn and deposited over the Post Office’s counters, which the first time the amount has crossed the £3.3 billion threshold in the entire 360 years that the Post Office has been established.
Personal cash withdrawals were up almost 8% month on month at £744 in June, and up over 20% from a year ago to £665 million in July.
The Bank of England expects inflation to be at around 13.3% in October and to remain at elevated levels throughout much of 2023, which is alarming to say the least.
Resorting to holding cash appears to be a method being used to attempt to budget more carefully during these times of high inflation, and the Post Office has also been processing government support for energy bills, an indicator that there are serious problems affording daily bills.
The British Pound remains relatively non-volatile, and certainly it will be interesting to see how long this trend lasts during a period at which many firms are attempting to do away with the use of cash entirely.
VIEW FULL ANALYSIS VISIT - FXOpen Blog
EUR/USD Aims Upside Break While USD/CHF Signals More Downsides

EUR/USD is struggling to clear the 1.0250 resistance zone. USD/CHF is declining and remains at a risk of a more losses below the 0.9520 level.
[B]Important Takeaways for EUR/USD and USD/CHF[/B]
[*] The Euro is facing a strong resistance near the 1.0250 zone against the US Dollar.
[*] There is a key bullish trend line forming with support near 1.0200 on the hourly chart of EUR/USD.
[*] USD/CHF started a fresh decline after it failed to clear the 0.9650 resistance zone.
[*] There was a break below a connecting bullish trend line with support near 0.9565 on the hourly chart.
EUR/USD Technical Analysis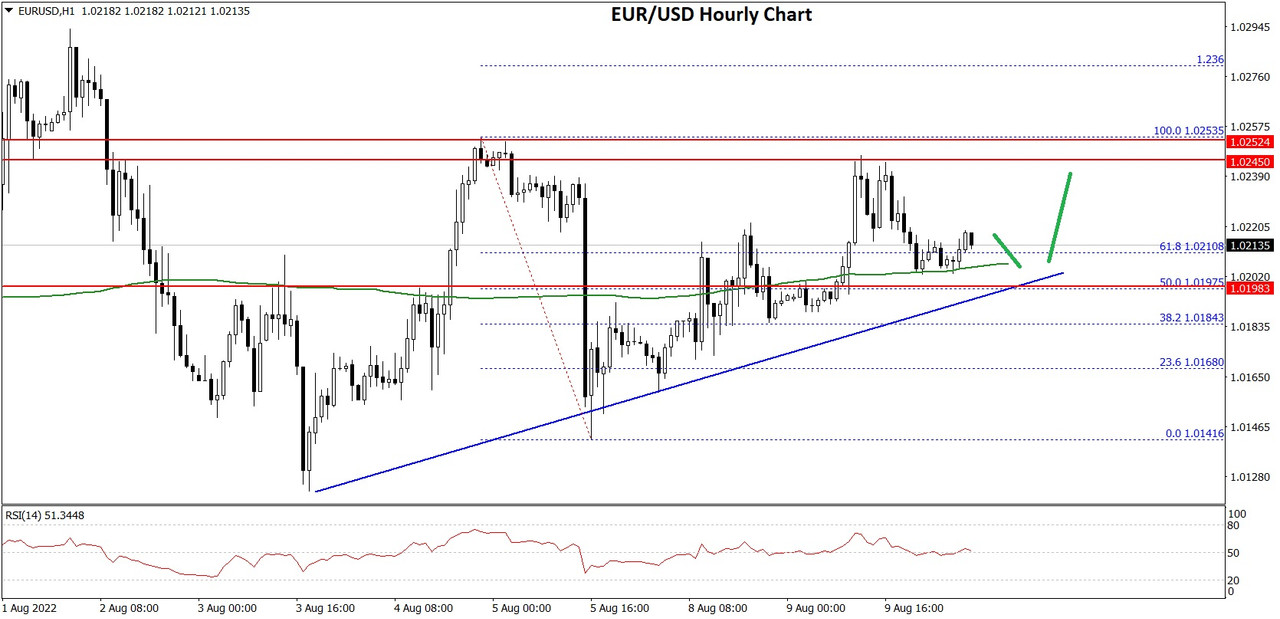
This past week, the Euro struggled to gain pace for a move above the 1.0250 level against the US Dollar. The EUR/USD pair formed a short-term top and reacted to the downside.
There was a break below the 1.0200 support, but the bulls were active near the 1.0150 level. A low was formed near 1.0141 on FXOpen and the pair is now recovering higher. There was a move above the 1.0180 resistance zone.
The pair climbed above the 1.0200 level and the 50 hourly simple moving average. The pair traded above the 50% Fib retracement level of the downward move from the 1.0253 swing high to 1.0141 low.
It is now trading above the 61.8% Fib retracement level of the downward move from the 1.0253 swing high to 1.0141 low. An immediate resistance is near the 1.0240 level. The next major resistance is near the 1.0250 level.
A clear move above the 1.0250 resistance zone could set the pace for a larger increase towards 1.0320. The next major resistance is near the 1.0350 zone.
On the downside, an immediate support is near the 1.0200 level. There is also a key bullish trend line forming with support near 1.0200 on the hourly chart of EUR/USD. The next major support is near the 1.0150 level. A downside break below the 1.0150 support could start another decline.
VIEW FULL ANALYSIS VISIT - FXOpen Blog
The end of the road for computer hardware as US indices dive
Those who have worked within any large company in a technical capacity will likely recall the sudden way in which computer hardware simply disappeared seamingly overnight.
Back in the 1990s, huge server farms and arrays of switches adorned massive rooms in most offices worldwide, and stacks of beige plastic desktop PCs whirred away all day.
Cabling was everywhere, and lights flashed as data was carried around the office, and IT professionals observed and controlled these gargantuan operations.
Suddenly, around 15 years ago, it all disappeared.
Server rooms gave way to open spaces and coffee machines, and suddenly the office space business grew toward coworker spaces and remote work.
The old beige stacks of in-house computers were gone, and cloud computing was in vogue.
What's that got to do with the stock market?
Well, quite a lot.
The computer hardware industry has long since disappeared from the top stocks, largely due to the aforementioned cloud computing revolution, but there has been one hardware type that has endured. Graphics cards.
NVIDIA, a publicly-listed American giant which manufactures graphics cards has been the final enduring stock on the blue-chip indices, and has been doing very well until now.
That's because graphics cards are used in cryptocurrency mining, and the vast, industrial-scale Chinese Bitcoin mining rigs which existed in mainland China until last year were using them en masse.
Suddenly, the Chinese government swept in and put an end to the use of cheap (and sometimes free) electricity that the commercial miners in China had been using and banned their operations in mid 2021.
Some operators moved their mining rigs outside China to regions with cheap or free electricity such as Kazakhstan or Armenia, but many gave up and moved on.
Since the cost of electricity in many other countries outweighs the potential gains made by Bitcoin mining, graphics card usage has declined and therefore NVIDIA stock has been volatile.
Right now, its earnings season, and NVIDIA has been in the news for having shown concern about its forthcoming earnings, given that the Bitcoin mining-related demand for graphics cards is down.
During the course of yesterday, the S&P 500 slid 0.4% and the Dow Jones Industrial Average fell 0.2%. The tech-heavy Nasdaq Composite lost 1.2%, closing down for a third consecutive day. Chip stocks are taking a beating after Micron Technology and Nvidia issued revenue warnings, dragging down the overall market with them.
It is perhaps a sign of the times, a sign that the final bastion of hardware-based computer science is coming to its nadir, but also a sign that modern innovation is once again on the march and as gas fees for other cryptocurrencies such as Ethereum will likely decrease, mining and the use of such tokens for other purposes such as smart contracts is the way of the future, all of which of course aim to further the cause of paperless and hardware-free lifestyle and business operations.
Onwards and upwards.
VIEW FULL ANALYSIS VISIT - FXOpen Blog
AUD/USD and NZD/USD Gain Bullish Momentum
AUD/USD is gaining pace above the 0.7050 resistance. NZD/USD is also eyeing a key upside break above the 0.6460 resistance.
Important Takeaways for AUD/USD and NZD/USD
[*] The Aussie Dollar started a fresh increase above the 0.7000 resistance zone against the US Dollar.
[*] There is a key bullish trend line forming with support near 0.7100 on the hourly chart of AUD/USD.
[*] NZD/USD also started a major increase from the 0.6220 support zone.
[*] There is a connecting bullish trend line forming with support near 0.6440 on the hourly chart of NZD/USD.
AUD/USD Technical Analysis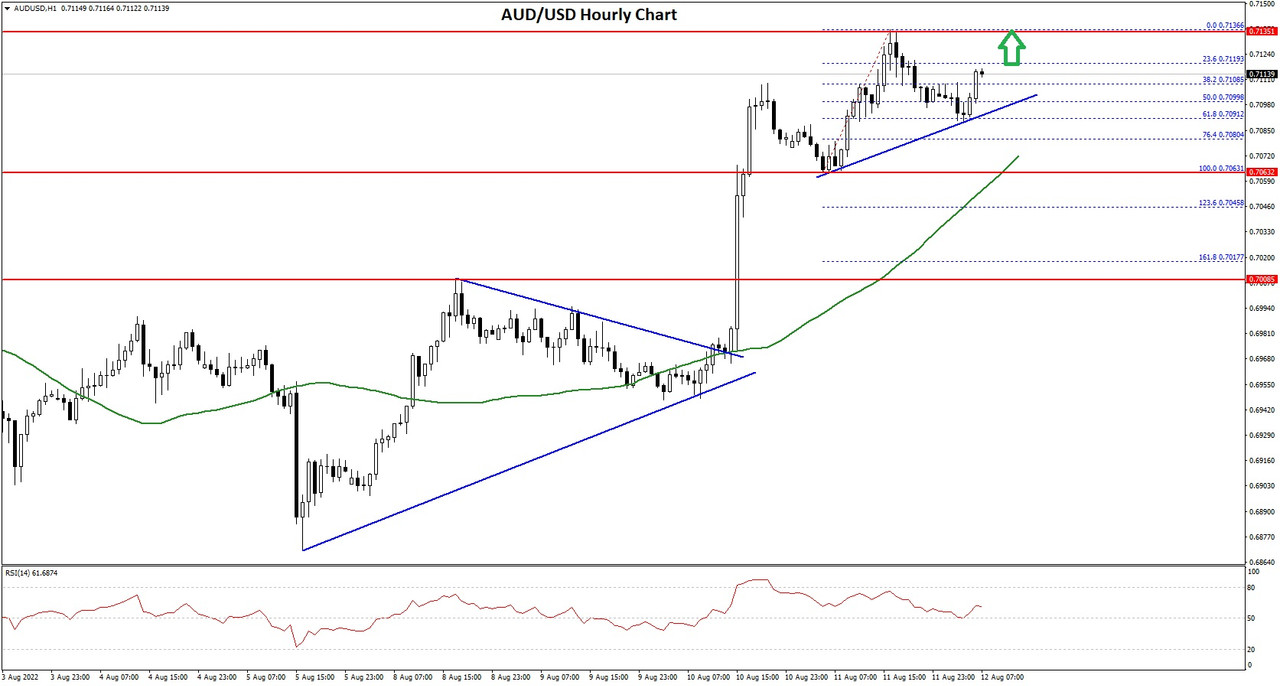
The Aussie Dollar formed a base above the 0.6920 and 0.6950 levels against the US Dollar. The AUD/USD pair started a steady increase after it cleared the 0.7000 resistance zone.
There was a clear move above the 0.7050 resistance and the 50 hourly simple moving average. The pair even broke the 0.7100 barrier and traded as high as 0.7136 on FXOpen. Recently, there was a minor downside correction below the 0.7120 level.
The pair dipped below the 50% Fib retracement level of the upward move from the 0.7063 swing low to 0.7136 high. However, the pair stayed above the 0.7100 level and the 50 hourly simple moving average.
The 61.8% Fib retracement level of the upward move from the 0.7063 swing low to 0.7136 high also acted as a support. The pair is now rising and trading near 0.7115.
There is also a key bullish trend line forming with support near 0.7100 on the hourly chart of AUD/USD. On the upside, the AUD/USD pair is facing resistance near the 0.7135 level. The next major resistance is near the 0.7150 level. A close above the 0.7150 level could start a steady increase in the near term. The next major resistance could be 0.7200.
On the downside, an initial support is near the 0.7100 level. The next support could be the 0.7070 level. If there is a downside break below the 0.7070 support, the pair could extend its decline towards the 0.7020 level.
VIEW FULL ANALYSIS VISIT - FXOpen Blog
GBP/USD and GBP/JPY At Risk of More Downsides
GBP/USD started a downside correction from the 1.2275 zone. GBP/JPY declined and remains at a risk of more losses below 161.20.
Important Takeaways for GBP/USD and GBP/JPY
[*] The British Pound failed to gain strength above the 1.2275 zone against the US Dollar.
[*] There is a major bullish trend line forming with support near 1.2110 on the hourly chart of GBP/USD.
[*] GBP/JPY declined steadily after it failed to clear the 163.65 resistance zone.
[*] There was a break below a key rising channel with support near 162.00 on the hourly chart.
GBP/USD Technical Analysis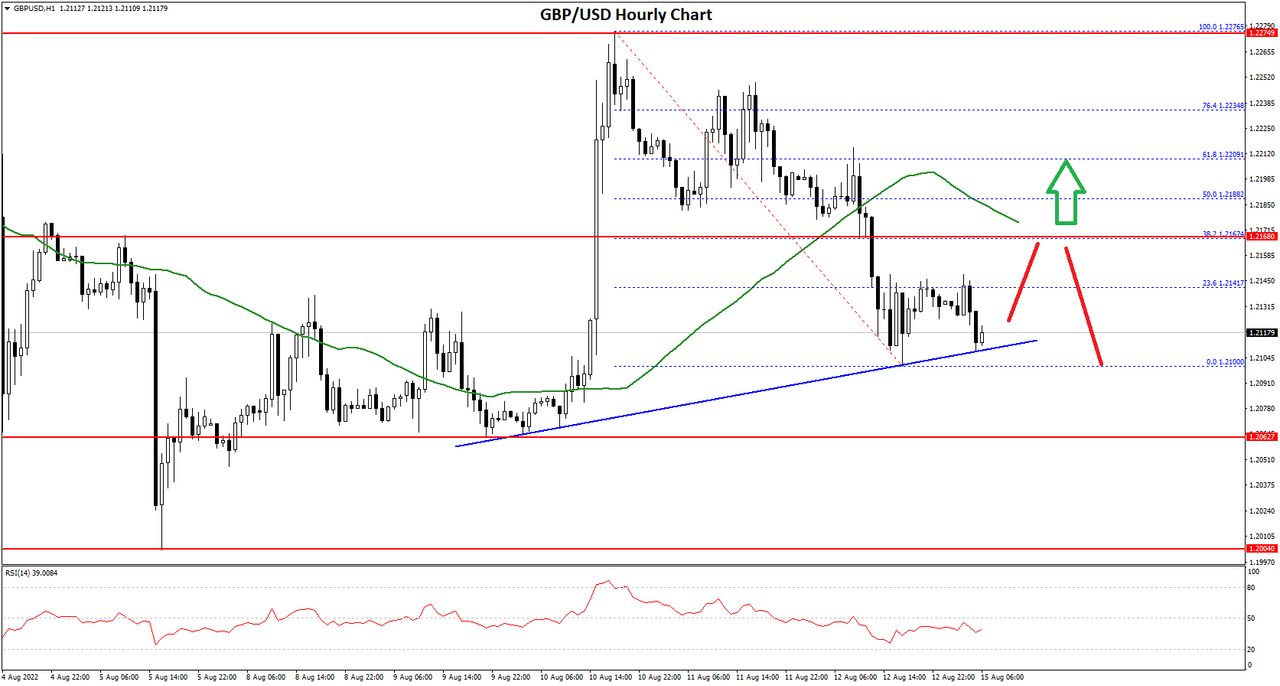
This past week, the British Pound found support near the 1.2000 zone against the US Dollar. The GBP/USD pair started a recovery wave and was able to settle above the 1.2100 zone.
There was a steady increase above the 1.2150 zone and the 50 hourly simple moving average. The pair even traded above the 1.2200 resistance zone. However, the bears were active near the 1.2275 and 1.2280 levels.
A high was formed near 1.2276 on FXOpen and the pair is now correcting lower. There was a move below the 1.2200 support zone. It even broke the 1.2150 level and the 50 hourly simple moving average.
A low is formed near 1.2100 and the pair is now consolidating losses. It is facing resistance near the 1.2140 level or the 23.6% Fib retracement level of the recent decline from the 1.2276 swing high to 1.2100 level.
The next major resistance is near the 1.2180 level and the 50 hourly simple moving average. It is near the 50% Fib retracement level of the recent decline from the 1.2276 swing high to 1.2100 level. An upside break above 1.2180 might start a fresh increase towards 1.2275.
An immediate support is near the 1.2110. There is also a major bullish trend line forming with support near 1.2110 on the hourly chart of GBP/USD.
The next major support is near the 1.2060 level. If there is a break below the 1.2060 support, the pair could test the 1.2000 support. Any more losses might send GBP/USD towards 1.1950.
VIEW FULL ANALYSIS VISIT - FXOpen Blog
Keep calm and carry on: London's FTSE 100 shows stoic approach has worked
For those who have managed to maintain enough enthusiasm to look beyond all of the doom and gloom which the world's media channels appear to revel in propagating, there has been some positive movements in the British economy over the past few days.
Behind all of the widespread reports of inflation, increasing energy costs and the general feeling that the Pound does not go anywhere near as far as it once did, there is some degree of comfort, and it is coming from the stock markets.
The FTSE 100 index, which is a collection of stocks of publicly listed giants which are regarded as the most prestigious on the UK market, has been performing very well.
As the bell sounded in the heart of the financial district in Britain's capital this morning, signaling another exciting week at the London Stock Exchange, the FTSE 100 began the day by increasing by 11.42 points to 7,512.31.
Whilst the Bank of England appears to be intent on maintaining its aggressive interest rate stance in the face of persistent inflation in the United Kingdom, the FTSE 100 index arrived at a 5-day high point by 9.00am today.
In fact, this morning's sudden upturn in fortune for the FTSE 100 represented the third highest point in six months, with trips over the 7,600 mark having taken place in April and June.
By 10.00am, the FTSE 100 had settled down to around 7,511 however that is still a high point for the prestigious index, despite a slight downward movement following this morning's spike at 9,00am and the index is still 11.5 points higher than its Friday afternoon close, and is 29 points up over the five-day moving average.
Oddly, despite inflation and a reducing purchasing power among consumers being a major consideration for almost every citizen of the United Kingdom (and many other western countries!) right now, investors have reacted positively to CPI and PPI data released this week that suggested inflation may have already peaked.
Conversely, confidence in the US market has taken a drop due to some vague allusion to possible geopolitical tensions between China and the United States as American lawmakers arrive for a trip to Taiwan, and Chinese economic data having revealed the ongoing impact of Covid-19 lockdowns and an escalating property crisis.
Evergrande, after all, is one of those rare insights into the potential over commitment by Chinese property giants that has been viewed from outside China; most of the time, it is impossible to gain any data on Chinese companies from outside the country.
Britain has been doing well by comparison, especially within the large corporations, and those are the corporations whose stock is listed in the FTSE 100 index.
The fabled stiff upper lip approach, and 'keep calm and carry on' culture has paid dividends... literally.
VIEW FULL ANALYSIS VISIT - FXOpen Blog
BTCUSD and XRPUSD Technical Analysis – 16th AUG 2022
BTCUSD: bearish Engulfing Pattern below $25196
bitcoin was unable to sustain its bullish momentum and after touching a high of 25196 on 15th Aug started to decline against the US dollar, coming below the $24000 handle today in the Asian trading session.
We can see that bitcoin failed to clear its resistance zone located at $25500 for the third time this month.
After touching a high of $25196, we can see some downward correction in the price towards the $23776 level.
We can clearly see a bearish engulfing pattern below the $25196 handle which is a bearish reversal pattern because it signifies the end of an uptrend and a shift towards a downtrend.
bitcoin touched an intraday high of 24250 in the Asian trading session and an intraday low of 23787 in the Asian trading session today.
both the STOCH and Williams percent range are indicating an overbought level which means that in the immediate short term, a decline in the prices is expected.
The relative strength index is at 43 indicating a weak demand for bitcoin at the current market level and the continuation of the selling pressure in the markets.
bitcoin is now moving below its 100 hourly simple moving average and its 200 hourly simple moving average.
Some of the major technical indicators are giving a sell signal, which means that in the immediate short term, we are expecting targets of 23500 and 23000.
The average true range is indicating less market volatility with a mildly bearish momentum.
[*] bitcoin: bearish reversal seen below $25196
[*] High/Lows is Indicating Neutral Levels
[*] The price is now trading just above its pivot level of $24017
[*] Most of the moving averages are giving a strong sell market signal
Bitcoin: bearish Reversal seen below $25196
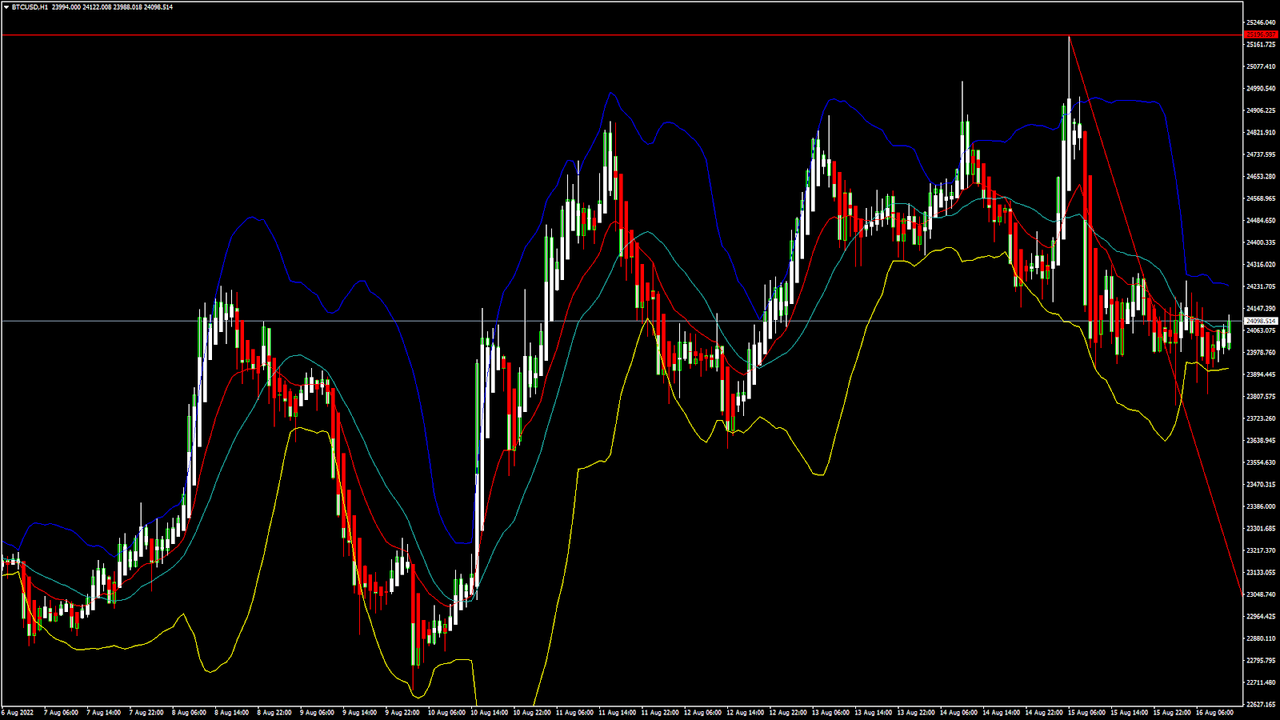
The price of bitcoin dipped to a low of 23828 after which we can see some buying support and a move towards the consolidation phase in the markets.
The bTCUSD is attempting a downside break due to the formation of a contraction triangle below the 24804 level.
We can see the formation of the Ichimoku bearish crossover pattern in the 4-hour time-frame indicating the underlying bearish nature of the markets.
The immediate short-term outlook for bitcoin is bearish; the medium-term outlook has turned neutral; and the long-term outlook remains neutral under present market conditions.
bitcoin’s support zone is located at $23000, and the prices continue to remain above these levels for any potential bullish reversal in the markets.
The price of bTCUSD is now facing its classic support level of 23873 and Fibonacci support level of 23982 after which the path towards 23000 will get cleared.
In the last 24hrs, bTCUSD has increased by 0.22% by 53$, and has a 24hr trading volume of USD 29.478 billion. We can see a 2.30% decrease in the trading volume as compared to yesterday, which appears to be normal.
The Week Ahead
The prices of bitcoin are moving in a consolidation zone above the $24000 level. The on-chain analysis also suggests that the markets are having more bearish tendencies and as such a drop in the levels is expected.
The daily RSI is printing at 58 which indicates a strong demand from the long-term investors.
The trendline formation is seen from the $25196 level towards the $23069, and we are now looking for the continuation of this trend in the hourly time frame.
The price of bTCUSD will need to remain above the important support level of $23000 this week.
The weekly outlook is projected at $24000 with a consolidation zone of $23500.
Technical Indicators:
The rate of price change: at -1.38 indicating a SELL
The ultimate oscillator: at 48.61 indicating a SELL
The relative strength index (14): at 49.35 indicating a NEUTRAL
The commodity channel index(14days): at -110.88 indicating a SELL
VIEW FULL ANALYSIS VISIT - FXOpen blog
EUR/USD and EUR/JPY Face Key Hurdles
EUR/USD started a fresh decline and traded below 1.0200. EUR/JPY is attempting a recovery wave and might rally if it clears 137.00.
Important Takeaways for EUR/USD and EUR/JPY
[*] The Euro started a major below the 1.0220 and 1.0200 support levels.
[*] There was a break above a key bearish trend line with resistance near 1.0165 on the hourly chart.
[*] EUR/JPY started an upside correction from the 135.00 support zone.
[*] There is a major bearish trend line forming with resistance near 136.60 on the hourly chart.
EUR/USD Technical Analysis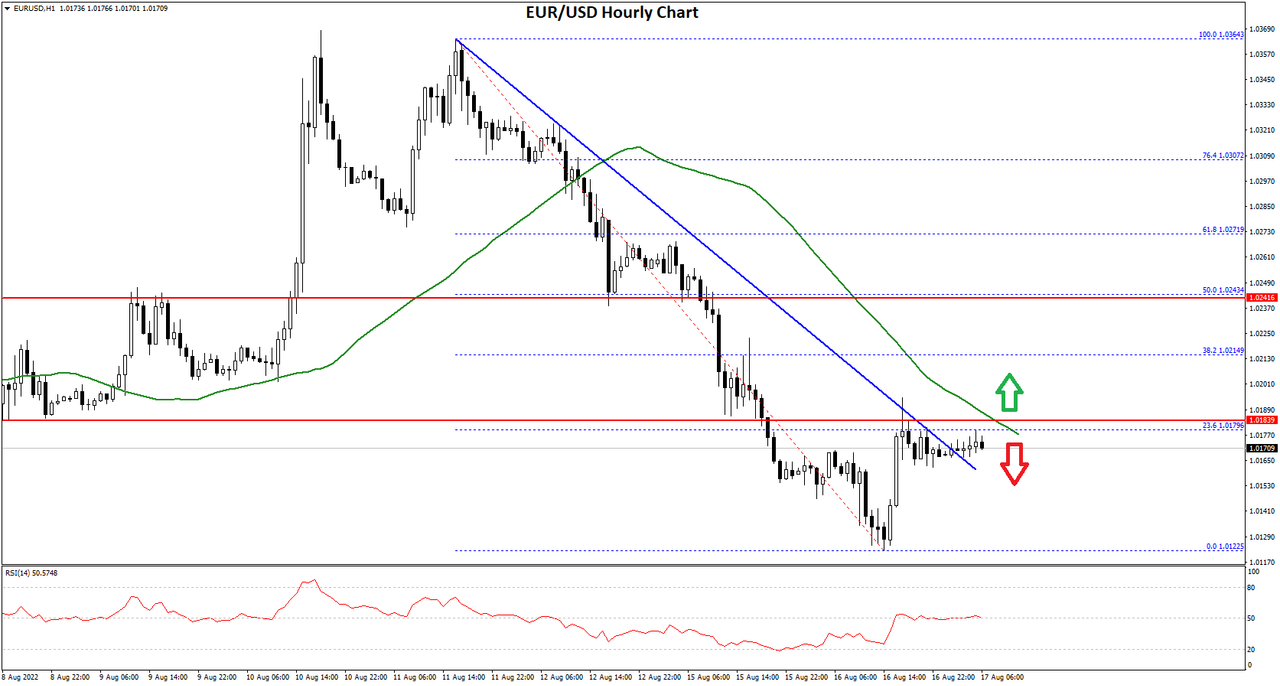
The Euro failed to clear the 1.0360 resistance against the US Dollar. The EUR/USD pair started a major decline below the 1.0300 and 1.0250 support levels.
There was a clear move below the 1.0220 level and the 50 hourly simple moving average. The pair even settled below the 1.0200 level. A low was formed near 1.0122 on FXOpen and the pair is now consolidating losses.
The pair recovered above 1.0150 and tested the 23.6% Fib retracement level of the downward move from the 1.0364 swing high to 1.0122 low.
Besides, there was a break above a key bearish trend line with resistance near 1.0165 on the hourly chart. On the upside, the pair is facing resistance near the 1.0180 level and the 50 hourly simple moving average.
A clear move above the 1.0180 resistance might send the price towards 1.0220. The next major resistance is near the 1.0240 level. It is near the 50% Fib retracement level of the downward move from the 1.0364 swing high to 1.0122 low. If the bulls remain in action, the pair could revisit the 1.0300 resistance zone in the near term.
On the downside, the pair might find support near the 1.0150 level. The next major support sits near the 1.0120 level. If there is a downside break below the 1.0120 support, the pair might accelerate lower in the coming sessions.
VIEW FULL ANALYSIS VISIT - FXOpen Blog