Daily Market Analysis By FXOpen
BTCUSD and XRPUSD Technical Analysis – 19th JULY 2022
BTCUSD: Triple Bottom Pattern Above $19640
Bitcoin was unable to sustain its bearish momentum and after touching a low of 18991 on 13th July started to correct upwards breaching the $22000 handle on 18th July.
We can see a continued appreciation in the price of bitcoin as global investor sentiments have improved leading to buying action seen in the markets at levels above $19000.
The price of bitcoin is poised to clear the resistance zone located at $23000 after which we will see a continuous upsurge in the levels of BTCUSD.
We can clearly see a triple-bottom pattern above the $19640 handle which is a bullish reversal pattern because it signifies the end of a downtrend and a shift towards an uptrend.
Bitcoin touched an intraday high of 22937 in the Asian trading session and an intraday low of 21588 in the European trading session today.
Both the STOCH and Williams percent range are indicating overbought levels which means that in the immediate short term, a decline in the prices is expected.
The relative strength index is at 50 indicating a neutral demand for bitcoin at the current market levels.
Bitcoin is now moving above its 100 hourly simple moving average and 200 hourly simple moving averages.
Some of the major technical indicators are giving a buy signal, which means that in the immediate short term, we are expecting targets of 22000 and 23000.
The average true range is indicating less market volatility with a bullish momentum.
[*] Bitcoin: bullish reversal seen above $19640
[*] The Williams percent range is indicating an overbought level
[*] The price is now trading just above its pivot level of $21805
[*] Most of the moving averages are giving a buy market signal
Bitcoin: Bullish Reversal Seen Above $19640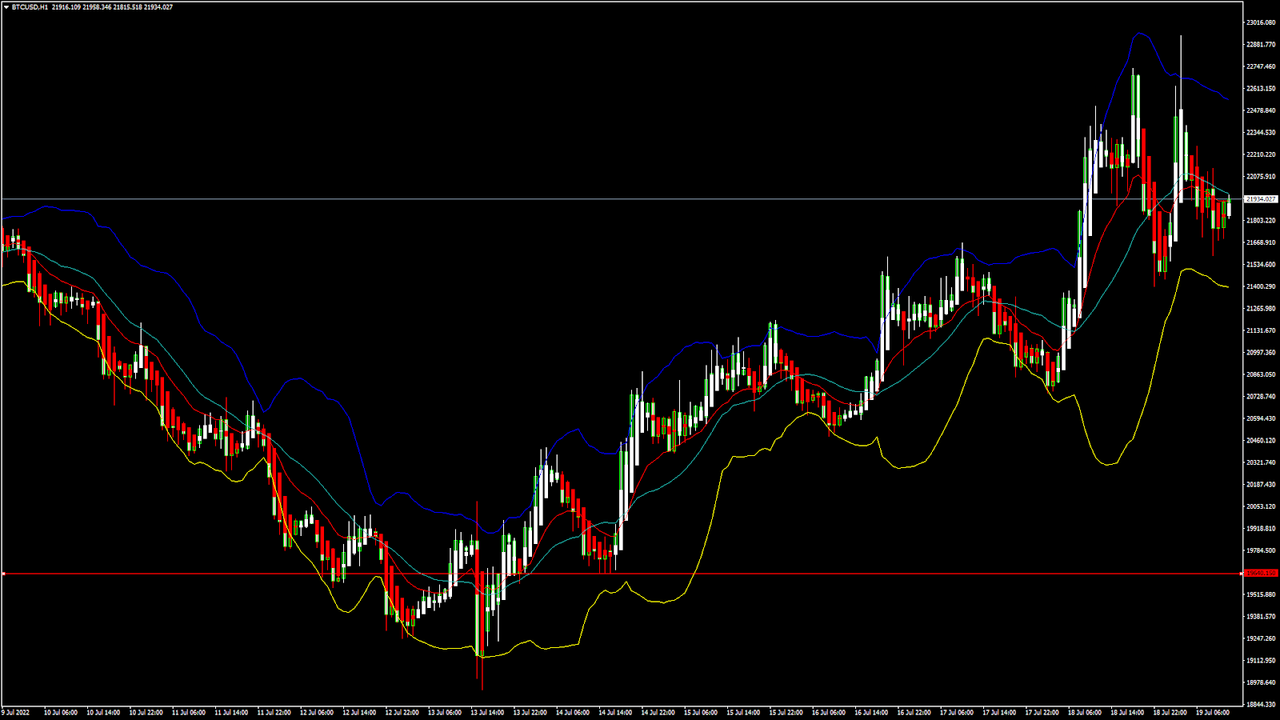
The price of Bitcoin continues to appreciate above the $21000 handle, and we are now testing the important resistance level of $23000 in the European trading session.
The global sentiments continue to improve leading to broad-based buying by the medium-term investors.
We can see the formation of a rising trend channel and are facing the immediate targets of $22000 and $22700.
Bitcoin’s bearish bias was invalidated above $19000, and we can see a correction wave that is stronger than the previous one.
We can see the formation of a bullish ABCD pattern in the hourly time frame which indicates that we are heading towards the $25000 level.
The immediate short-term outlook for bitcoin is bullish; the medium-term outlook has turned neutral; and the long-term outlook remains neutral under present market conditions.
Bitcoin’s support zone is located at $20500, and the prices continue to remain above this level for the continuation of the bullish phase of the markets.
The price of BTCUSD is now facing its classic resistance level of 21868 and Fibonacci resistance level of 21963 after which the path towards 22000 will get cleared.
In the last 24hrs, BTCUSD has declined by 1.73% by 385$ and has a 24hr trading volume of USD 45.154 billion. We can see an increase of 39.50% in the trading volume as compared to yesterday, which is due to the buying seen by the medium-term investors.
The Week Ahead
The price of bitcoin is moving in a bullish momentum, and the immediate targets are $22500 and $23500.
The daily RSI is printing at 53 which means that the medium range demand continues to remain neutral.
We can see the continuation of the recovery mode in bitcoin with the prices touching the $23000 and $24000 levels next week.
The price of BTCUSD will need to remain above the important support level of $20000 this week.
The weekly outlook is projected at $23500 with a consolidation zone of $22500.
Technical Indicators:
The average directional change (14 days): at 25.10 indicating a buy
The ultimate oscillator: at 59.03 indicating a buy
The rate of price change: at 8.61 indicating a buy
The commodity channel index(14days): at 136 indicating a buy
Read Full on FXOpen Company Blog...
EUR/USD Starts Recovery While USD/CHF Dips Below Support
EUR/USD started a recovery wave above the 1.0200 level. USD/CHF is declining and broke a key support near the 0.9750 zone.
Important Takeaways for EUR/USD and USD/CHF
[*] The Euro started a decent recovery wave above the 1.0150 zone against the US Dollar.
[*] There is a key bullish trend line forming with support near 1.0225 on the hourly chart of EUR/USD.
[*] USD/CHF started a fresh decline after it failed to clear the 0.9880 resistance zone.
[*] There is a major bearish trend line forming with resistance near 0.9720 on the hourly chart.
EUR/USD Technical Analysis
This past week, the Euro gained pace below the 1.0100 support against the US Dollar. The EUR/USD pair even spiked below the parity level and traded as low as 0.9952 on FXOpen.
Recently, there was a recovery wave above the 1.0000 and 1.0100 resistance levels. The pair climbed above the 1.0150 level and the 50 hourly simple moving average. The pair traded as high as 1.0268 and is currently showing positive signs.
EUR/USD Hourly Chart
There was a minor drop and a test of the 23.6% Fib retracement level of the upward move from the 1.0119 swing low to 1.0268 high.
An immediate resistance is near the 1.0255 level. The next major resistance is near the 1.0270 level. A clear move above the 1.0270 resistance zone could set the pace for a larger increase towards 1.0350. The next major resistance is near the 1.0450 zone.
On the downside, an immediate support is near the 1.0230 level. There is also a key bullish trend line forming with support near 1.0225 on the hourly chart of EUR/USD.
The next major support is near the 1.0200 level. It is near the 50% Fib retracement level of the upward move from the 1.0119 swing low to 1.0268 high. A downside break below the 1.0200 support could start another decline.
Read Full on FXOpen Company Blog...
Big Tech stock languishes, whilst UK inflation rampages
This week started off with very big moves among the Big Tech stocks on North America's markets, a dynamic which has continued throughout the week so far.
On Monday, Apple stock fell more than 2% in its worst trading session in almost three weeks after Bloomberg revealed the company’s plans to slow hiring and spending to cope with a potential economic downturn. Yesterday, Meta (previously Facebook) was in the news, with its CEO Mark Zuckerberg stating quite ruthlessly that the company will simply tell all of its employees that it 'does not need' to simply go home.
There are now some commentators who consider that the big tech stocks listed on New York's prominent exchanges have even further to fall.
Apple stock has decreased in value by a remarkable 17% during the course of 2022, and other large software giants and internet stalwarts such as Microsoft and Google (Alphabet) having fallen in value over a sustained period of time.
A point of interest with this otherwise gloomy outlook is that the declining nature of Apple stock is having a bearing on the total value of all big tech stocks.
The spread between the prospective earnings multiples of the S&P 500 Information Technology Sector and the benchmark S&P 500 started this year at the highest it had been since 2004, which is encouraging, and shows that perhaps a few of the giants which have been struggling to keep the value of their shares up have affected the entire outlook for big tech when in reality there are firms doing well.
Overall, however, the differential between the downturn in big tech stock values in New York and other stocks on prominent exchanges elsewhere is interesting.
London's FTSE 100, largely consisting of less tech-focused stocks and more on long-established, age-old blue chip companies in mining, manufacturing, pharmaceuticals, finance, consumer retail and engineering industries, has been stable despite the United Kingdom's economic situation having reached a milestone inflation level which is now at its highest in 40 years.
It is apparent that many investors in the United Kingdom are looking for inflation-busting opportunities, and are taking a cautious approach, especially given that many London listed stocks are valued in Pounds and Pence, and at a time during which the governmental changes are creating uncertainty.
FXOpen Blog
ETHUSD and LTCUSD Technical Analysis – 21st JULY, 2022
ETHUSD: Hanging Man Pattern Below $1627
Ethereum was unable to sustain its bullish momentum and after touching a high of 1627 on 19th July started to decline against the US dollar coming down below the $1500 handle in the European trading session today.
We can see that ETH is losing ground against the US dollar and no major uptrend formation was seen.
The prices touched an intraday low of $1466 and an intraday high of $1565 in the Asian trading session today.
We can clearly see a hanging man pattern below the $1627 handle which is a bearish pattern and signifies the end of a bullish phase and the start of a bearish phase in the markets.
ETH is now trading just above its pivot levels of 1485 and moving into a mildly bearish channel. The price of ETHUSD is now testing its classic support level of 1450 and Fibonacci support level of 1476 after which the path towards 1300 will get cleared.
The relative strength index is at 39 indicating a weak market and the continuation of the downtrend in the markets.
We can see the progression of a bearish trendline formation from $1627 to $1488 which indicates that we are heading towards $1436.
Both the commodity channel index and Williams percent range are indicating a neutral market.
All of the technical indicators are giving a strong sell market signal.
Most of the moving averages are giving a sell signal, and we are now looking at the levels of $1400 to $1350 in the short-term range.
ETH is now trading above both its 100 hourly simple and exponential moving averages.
[*] Ether: bearish reversal seen below the $1627 mark
[*] Short-term range appears to be mildly bearish
[*] ETH continues to remain above $1400
[*] The average true range is indicating less market volatility
Ether: Bearish Reversal Seen Below $1627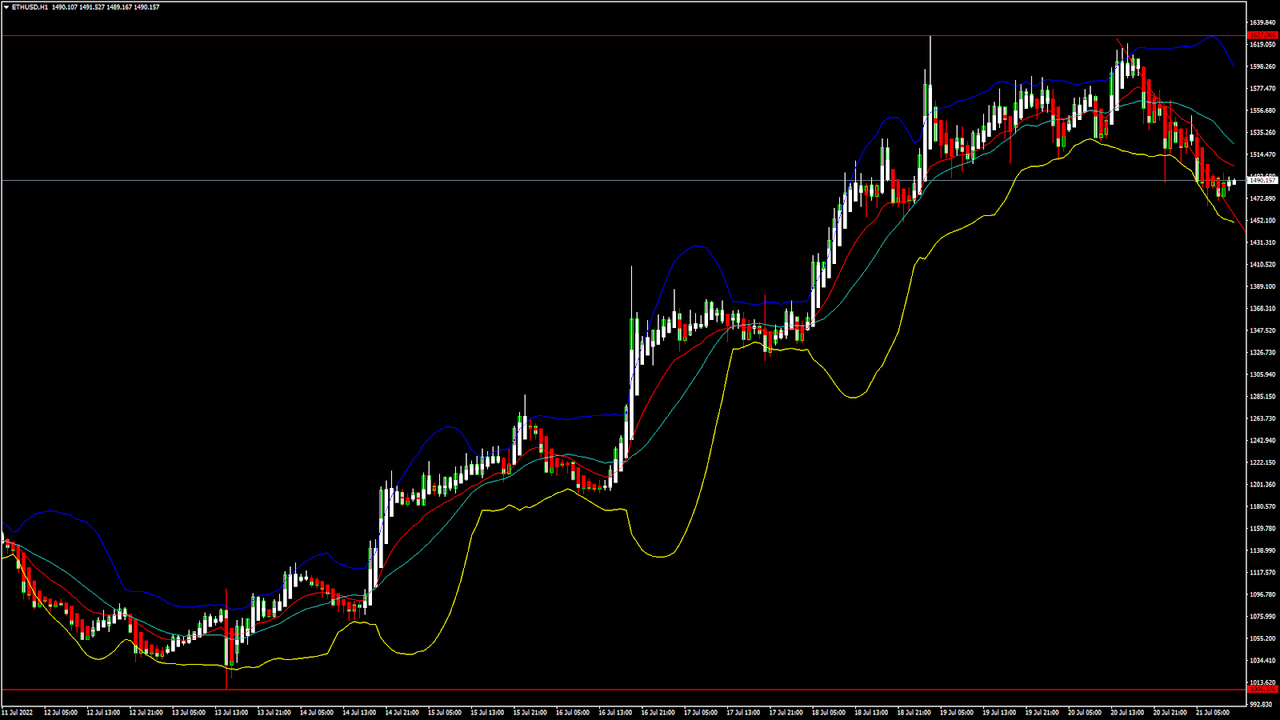
ETHUSD is now moving into a mildly bearish channel with the prices trading below the $1500 handle in the European trading session today.
We have also detected the formation of MA20 and MA50 crossover patterns located at 1529 and 1545 in the hourly time frame indicating that the price is likely to descend below.
We can see that the prices of Ethereum are slowly preparing for moving into a consolidation channel above the $1400 handle.
We can also see the formation of three black crows patterns in the 15-minute time frame indicating the bearish nature of the markets.
In the 2-hour time frame, the super trend indicator is giving bearish reversal signals.
The key support levels to watch are $1385 and $1335, and the prices of ETHUSD need to remain above these levels for any potential bullish reversal in the markets.
ETH has decreased by 2.79% with a price change of 42$ in the past 24hrs and has a trading volume of 23.086 billion USD.
We can see an increase of 2.31% in the total trading volume in the last 24 hrs. which appears to be normal.
The Week Ahead
We can see that ETH failed to clear the resistance zone located at $1650, and with the continued bearish reversal, we are now heading towards the $1400 level.
The prices of Ethereum are preparing to enter into a consolidation phase below the $1500 level and we can see some range-bounded movements between the $1400 and $1500 levels this week.
The immediate short-term outlook for Ether has turned mildly bearish; the medium-term outlook has turned neutral; and the long-term outlook for Ether is neutral in present market conditions.
The price of ETHUSD will need to remain above the important support level of $1400 this week.
The weekly outlook is projected at $1550 with a consolidation zone of $1400.
Technical Indicators:
STOCH (9,6): at 22.50 indicating a sell
The moving averages convergence divergence (12,26): at -17.75 indicating a sell
The rate of price change: at -3.93 indicating a sell
The ultimate oscillator: at 46.50 indicating a sell
Read Full on FXOpen Company Blog...
Gold Price and Crude Oil Price Aim Fresh Increase

Gold price started a major decline below the $1,725 support zone. Crude oil price is attempting a fresh increase from the $88.80 support zone.
Important Takeaways for Gold and Oil
[*] Gold price struggled above $1,740 and declined against the US Dollar.
[*] Recently, there was a break above a key bearish trend line with resistance near $1,705 on the hourly chart of gold.
[*] Crude oil price started a downside correction from the $100 and $101 resistance levels.
[*] There was a break below a major bullish trend line with support near $98.95 on the hourly chart of XTI/USD.
Gold Price Technical Analysis
Gold price struggled to gain pace above the $1,750 resistance zone against the US Dollar. The price started a fresh decline and traded below the $1,725 pivot level.
There was a clear move below the $1,712 support zone and the 50 hourly simple moving average. The price even traded below the $1,700 level and formed a low near $1,680 on FXOpen. It is now correcting losses above the $1,695 level.
Gold Price Hourly Chart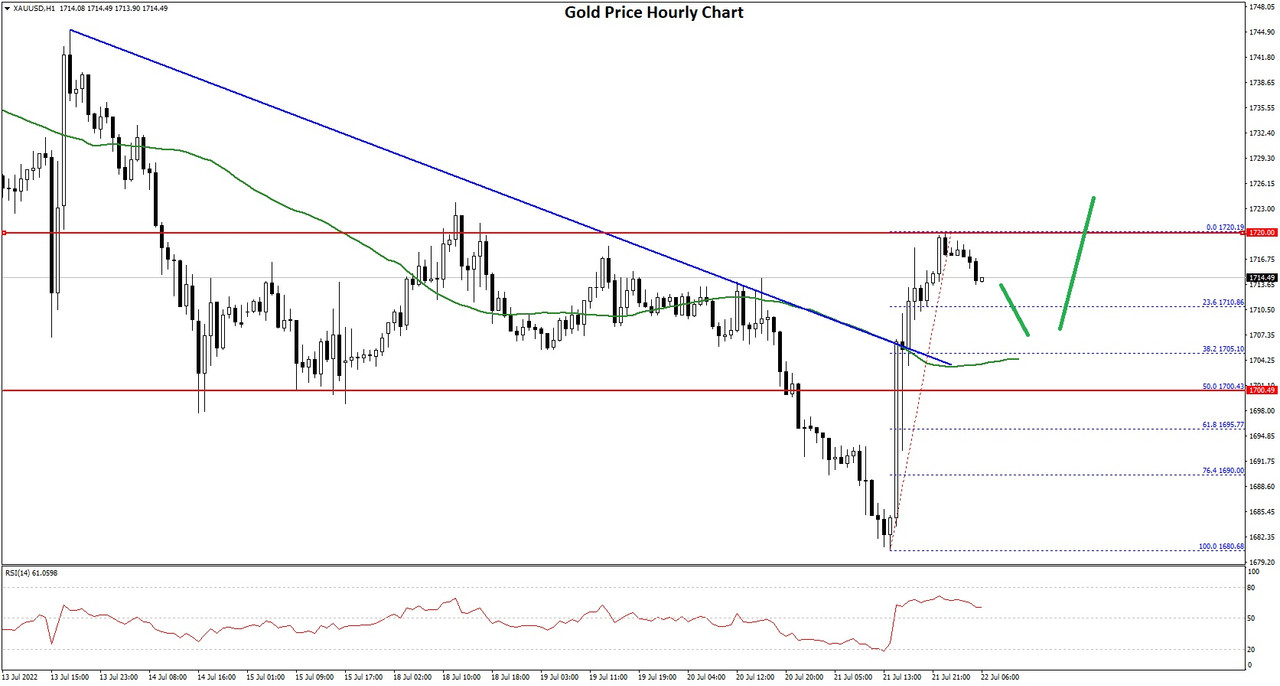
There was a break above a key bearish trend line with resistance near $1,705 on the hourly chart of gold. The price even climbed above the $1,712 level but struggled to clear $1,720.
A high is formed near $1,720 and the price is now consolidating gains. On the downside, an initial support is near the $1,710 level. It is near the 23.6% Fib retracement level of the upward move from the $1,680 swing low to $1,720 high.
The next major support is near the $1,700 level or the 50% Fib retracement level of the upward move from the $1,680 swing low to $1,720 high, below which there is a risk of a larger decline. In the stated case, the price could decline sharply towards the $1,680 support zone.
On the upside, the price is facing resistance near the $1,720 level. A clear upside break above the $1,720 resistance could send the price towards $1,735. The main resistance is now forming near the $1,750 level. A close above the $1,750 level could open the doors for a steady increase towards $1,780.
Read Full on FXOpen Company Blog...
Watch FXOpen's July 18 - 22 Weekly Digest Video
In this video, FXOpen UK COO Gary Thomson sums up the week’s happenings and discusses the most significant news reports.
[*] British pound begins to rise, but still faces challenges
[*] EUR/USD starts recovery while USD/CHF dips below support
[*] What will make oil prices skyrocket?
[*] Big Tech stock languishes, whilst UK inflation rampages
Watch our short and informative video, and stay updated with FXOpen.
FXOpen YouTube
GBP/USD Faces Resistance And GBP/JPY Is Sliding
GBP/USD started a recovery wave above the 1.1950 resistance zone. GBP/JPY declined and remains at a risk of more losses below 163.00.
Important Takeaways for GBP/USD and GBP/JPY
[*] The British Pound started a recovery wave above the 1.1950 resistance against the US Dollar.
[*] There is a major bullish trend line forming with support near 1.1960 on the hourly chart of GBP/USD.
[*] GBP/JPY declined steadily after it failed to clear the 166.20 resistance zone.
[*] There was a break below a key bullish trend line with support near 165.60 on the hourly chart.
GBP/USD Technical Analysis
This past week, the British Pound found support near the 1.1750 zone against the US Dollar. The GBP/USD pair started a recovery wave and was able to settle above the 1.1850 zone.
There was a steady increase above the 1.1900 zone and the 50 hourly simple moving average. The pair even traded above the 1.2000 resistance zone. However, the bears were active near the 1.2050 and 1.2060 levels.
GBP/USD Hourly Chart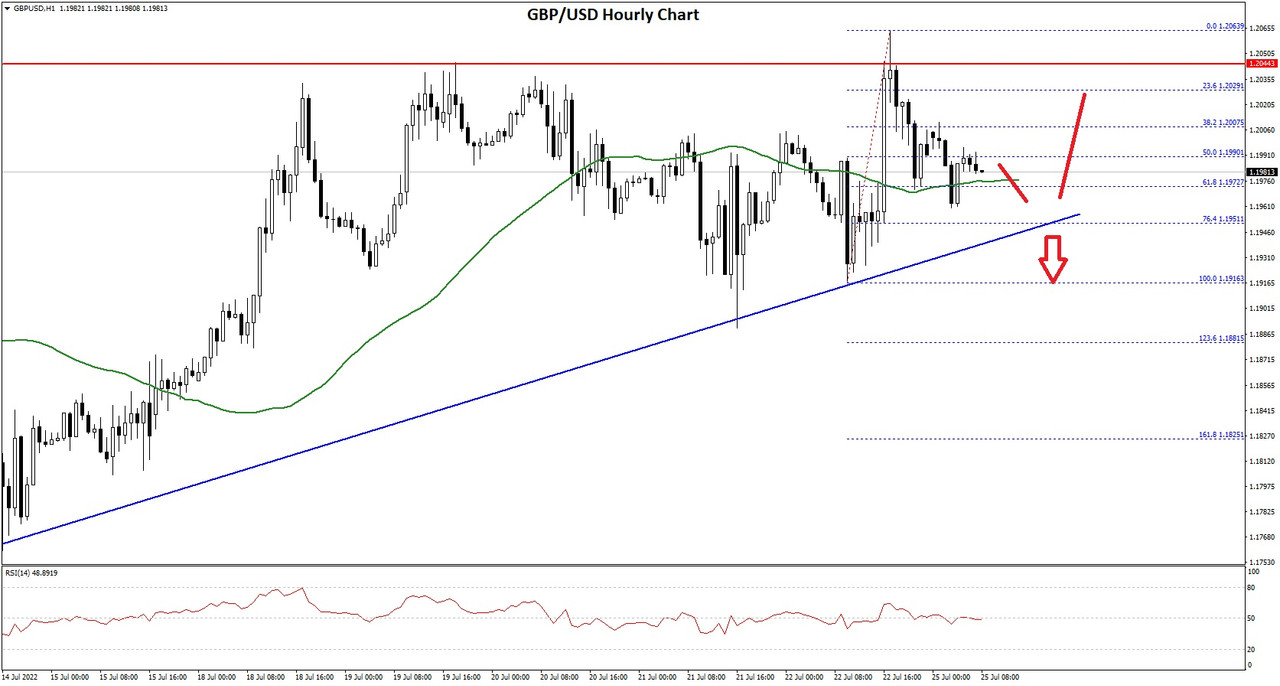
A high was formed near 1.2063 on FXOpen and the pair is now correcting lower. There was a move below the 1.2000 support zone. It even broke the 50% Fib retracement level of the upward move from the 1.1916 swing low to 1.2063 high.
An immediate support is near the 1.1975 and the 50 hourly simple moving average. The next major support is near the 1.1960 level. There is also a major bullish trend line forming with support near 1.1960 on the hourly chart of GBP/USD.
If there is a break below the 1.1960 support, the pair could test the 1.1920 support. Any more losses might send GBP/USD towards 1.1850. On the upside, the pair is facing resistance near the 1.2000 level and the 1.2020.
An upside break above 1.2020 could set the pace for a move towards the 1.2060 resistance zone. The next major resistance sits near the 1.2120 level.
Read Full on FXOpen Company Blog...
Oil price bonanza may trigger dividend hike for big firms
The incessant increase in the price of oil over recent months has been a moot point for many people, especially those in western countries who are now having to battle with the cost of paying for their domestic heating or the painful cost of buying fuel for their car.
What appeared inconceivable last year when oil prices were very low and had only just begun to recover from the negative equity position that crude oil was in in March 2020, is now a very harsh reality for many domestic and commercial consumers, just as it is for commodities traders who have to make their investment in crude oil work against the backdrop of a surprisingly strong US Dollar.
Currently, the price of oil is still extremely high, with Brent Crude commanding a price of $103 per barrel at July 25, and oil companies are quite simply raking in the profits.
The sanctions which were placed on companies in all sectors of industry based in Russia earlier this year have also had an impact on the price of crude oil, as Russia is an OPEC country and has a vast oil and raw materials industry which exports its products globally.
Once the ability for Russian oil companies to access their settlement payments for oil and gas in Euros or US Dollars via European and North American banks became impossible due to the freezing of those accounts, and Russian oil companies ended up insisting that European and American customers settle their oil and gas purchases in Rubles via Russian banks, the US Dollar became less connected to the commodities settlement business and the ruble shot up, but of course overall demand for oil remained very high.
As a result, the dollar value of oil is still high indeed.
Some of the top international oil majors have already announced expectations of extremely high revenues, especially in their refining divisions, for the second quarter of this year.
A number of analysts expect at least some of them to step up share buybacks and some even to announce an increase in dividends due to record cash flows and record or near-record earnings.
Some Western oil companies are doing very well indeed, as this is a global phenomenon and a global supply and demand issue.
French supermajor TotalEnergies said last week that “Refining & Chemicals results are expected to be exceptional given the very high levels of distillate and gasoline cracks.”
American oil giant ExxonMobil revealed in an SEC filing earlier this month that the rise in industry margins is set to add between $4.4 billion and $4.6 billion to its Q2 results.
At Shell, which recently moved its headquarters from its native Holland to London purely so that it can be in the global trading center for electronic financial services, the refining margin nearly tripled in Q2 compared to Q1 and is expected to add between $800 million and $1.2 billion to the second quarter results of Shell’s Products division compared to the first quarter of 2022.
Therefore, not only are oil stocks in view, but oil prices themselves.
FXOpen Blog
Tesla stock has volatile week despite Bitcoin unicorn
Tesla has been known for as long as it has been in existence as a disruptor of its sector.
Its founder, Elon Musk, is a maverick and a free thinker and has risen to prominence as one of the world's richest men via his methodology of disregarding the well-trodden path and finding ways to reinvent it.
Thus, Elon Musk's influential interest in cryptocurrency has been a well-covered subject over the past year and a half, and his own advocacy of cryptocurrencies ranging from Bitcoin to oddball meme currencies such as Dogecoin has been high profile.
It is fair to say that Elon Musk's interest in cryptocurrency is not just an interest, it positions him as an influencer.
In May 2021, he was responsible for crashing the value of five popular cryptocurrencies by over $700 million, and then partially responsible for causing them to rise to a higher value than before his infamous Twitter post-orientated tumble.
It is therefore fitting that Elon Musk would bring cryptocurrency investment into his commercial portfolio, which he did with Tesla.
By the end of last year, Tesla could lay claim to being the most influential disrupting force in the automotive industry, as well as the only large cap publicly listed corporation which is a Bitcoin whale.
A Bitcoin whale is an entity or person which holds enough Bitcoin to be able to influence the market.
Now, as Tesla remains a major market force and all of the traditional car manufacturers have been rallying to make electric vehicles after over 100 years of not even considering moving away from internal combustion, and as a recent SEC filing showed that the company has made $64 million in gains from bitcoin sales, its own stock is volatile to say the least.
This week, prices are down to $804 per share after a rally last week.
Whether investors in high market cap publicly listed companies are still relatively conservative and don't favor risky and avantgarde strategies such as the Bitcoin trading activities of Tesla is perhaps a matter for discussion, but despite these crypto-fueled gains being made public information, the value of Tesla stock has been declining during the course of this week.
On Friday last week, Tesla stock was trading at $840 per share, so today's $804 is a definitive downturn.
Elon Musk, who is openly pro-free market, and has objected to government lockdowns across Europe and America has this week stated that Tesla’s factories in Germany and Texas are losing billions of dollars as supply-chain snags and battery-cell manufacturing hurdles limit production caused by the draconian lockdowns in 2020 and 2021.
Clearly, regardless of how well capitalized and how much of a market icon Tesla is, foresight, innovation and disruption still equals volatility.
FXOpen Blog
BTCUSD and XRPUSD Technical Analysis – 26th JULY 2022
BTCUSD: Bearish Engulfing Pattern Below $24262
Bitcoin was unable to sustain its bullish momentum and after touching a high of 24195 on 20th July started to decline against the US dollar dropping below the $21500 handle in the European trading session today.
We can see that after this decline the prices have entered into a consolidation zone above the $21000 handle.
The drop in the prices of bitcoin comes just before the upcoming US Federal Reserve FOMC meeting, which is expected to raise the interest rates by 75 basis points.
We can clearly see a bearish engulfing pattern below the $24262 handle which is a bearish reversal pattern because it signifies the end of an uptrend and a shift towards a downtrend.
Bitcoin touched an intraday high of 22248 in the Asian trading session and an intraday low of 20928 in the European trading session today.
Both the STOCH and Williams percent range are indicating overbought levels which means that in the immediate short term, a decline in the prices is expected.
The relative strength index is at 29 indicating a weaker demand for bitcoin at the current market level and the continuation of the selling pressure in the markets.
Bitcoin is now moving below its 100 hourly simple moving average and 200 hourly simple moving averages.
Most of the major technical indicators are giving a strong sell signal, which means that in the immediate short term, we are expecting targets of 20500 and 20000.
The average true range is indicating less market volatility with a bearish momentum.
[*] Bitcoin: bearish reversal seen below $24262
[*] STOCHRSI is indicating an overbought level
[*] The price is now trading just above its pivot level of $21077
[*] All of the moving averages are giving a strong sell market signal
Bitcoin: Bearish Reversal Seen Below $24262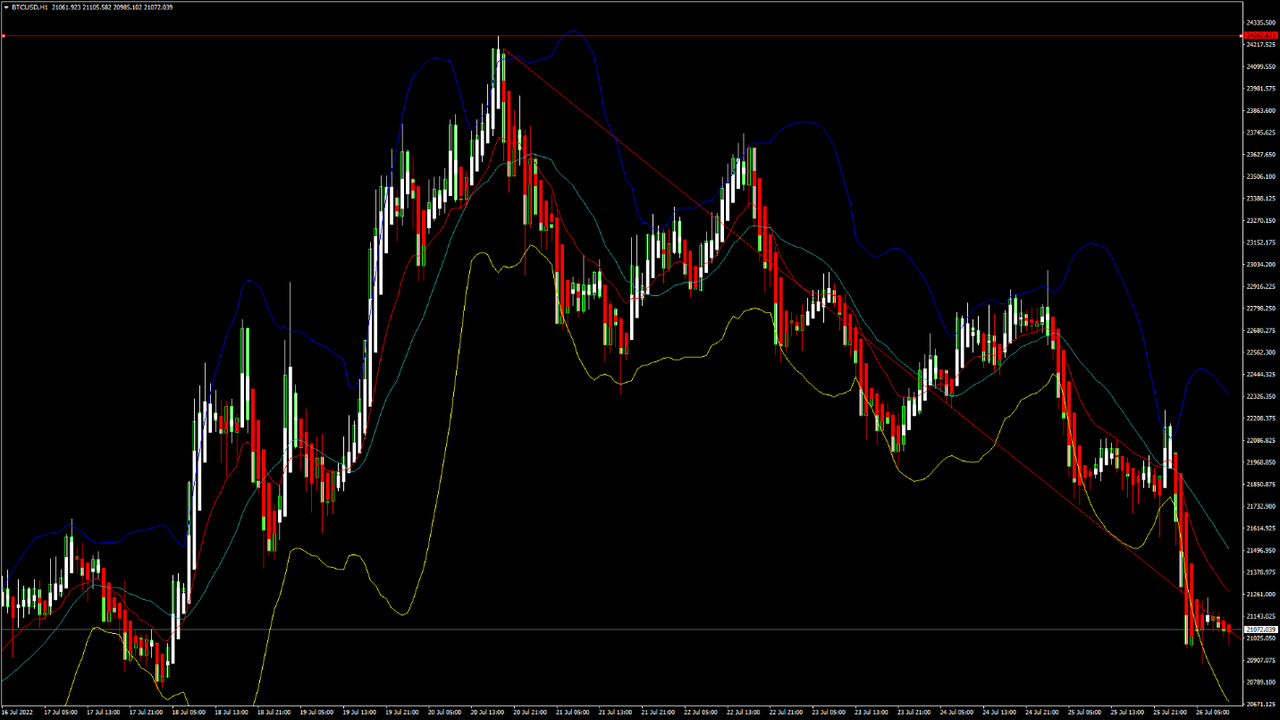
The price of bitcoin continues to decline below the $22000 handle, and we are now testing the important support level of $20000 in the European trading session.
The global sentiments have changed in the wake of the US Fed interest rate decision and its impact on the cryptocurrency markets worldwide.
We can see the formation of a falling trend channel, and now we are facing the immediate targets of $20500 and $20100.
Bitcoin was unable to clear its resistance zone located at $25000, and we can see a progression of the bearish bias in the markets.
The ultimate oscillator is indicating a neutral market, and the prices can also stage an upwards correction from these levels if the bearish trend gets exhausted.
The immediate short-term outlook for bitcoin is bearish; the medium-term outlook has turned neutral; and the long-term outlook remains neutral under present market conditions.
Bitcoin’s support zone is located at $20000, and the prices continue to remain above these levels for any potential bullish reversal in the markets.
The price of BTCUSD is now facing its classic support level of 20902, and Fibonacci resistance levels of 21034, after which the path towards 20000 will get cleared.
In the last 24hrs, BTCUSD has declined by 4.19% by 922 and has a 24hr trading volume of USD 37.899 billion. We can see an increase of 33.97% in the trading volume as compared to yesterday, which is due to the selling seen by the short-term investors.
The Week Ahead
The price of bitcoin is moving in a mildly bearish momentum, and the immediate targets are $20500 and $20000
The daily RSI is printing at 44 which means that the medium range demand continues to remain weak.
The trendline formation is seen from the $24000 level towards the $21000, indicating that if this bearish trend line gets exhausted, we may see an upwards correction in the prices.
Bitcoin prices may continue to remain in a range-bound movement between the $20000 and $22000 levels this week.
The price of BTCUSD will need to remain above the important support levels of $20000 this week.
The weekly outlook is projected at $21500 with a consolidation zone of $20500.
Technical Indicators:
The average directional change (14 days): at 43.57 indicating a NEUTRAL
The rate of price change: at -3.78 indicating a SELL
The relative strength index (14): at 29.67 indicating a SELL
The commodity channel index (14 days): at -59.39 indicating a SELL
Read Full on FXOpen Company Blog...