Daily Market Analysis By FXOpen
TOP-20 most powerful currencies in the world
According to the United Nations, 180 currencies are legal tender, but when asked what is the strongest currency in the world, what comes to mind? The US dollar, which is strengthening because of the Fed’s hawkish monetary policy stance in response to skyrocketing inflation. Or the euro, despite the International Monetary Fund predicting just 0.5% growth in the European economy in 2023 and warning that “the worst is yet to come” due to the war in Ukraine, record inflation, and the impact of the COVID-19 pandemic. Perhaps the British pound, despite the UK’s challenging domestic picture? You’d be surprised to learn that there are currencies that outperform the trio.
FXOpen has compiled a list of the world's top-20 currencies in the world as of 2022. Learn which is number one, and which are stronger than USD, EUR, and GBP despite the latters’ title of the most famous, most traded, and most widely spread currencies of the world.
Trading currencies involves simultaneously buying one currency and selling another, which is known as currency comparison. In the following list, all currencies are quoted against one US dollar.
VIEW FULL ANALYSIS VISIT - FXOpen Blog...
Disclaimer: CFDs are complex instruments and come with a high risk of losing your money.
ETHUSD and LTCUSD Technical Analysis – 24th NOV, 2022
ETHUSD: Bullish Engulfing Pattern Above $1075
Ethereum was unable to sustain its bullish momentum and after touching a high of 1230 on 20th Nov, the prices started to decline against the US dollar touching a low of 1078 on 22nd Nov.
After this decline we can see some upwards correction in the levels of Ethereum towards the $1200 handle.
We can see a three white soldiers pattern in the daily time frame indicating the Bullish trend.
We can clearly see a bullish engulfing pattern above the $1075 handle which is a bullish pattern and signifies the end of a bearish phase and the start of a bullish phase in the markets.
ETH is now trading just above its pivot levels of 1201 and moving into a strongly bullish channel. The price of ETHUSD is now testing its classic resistance level of 1205 and Fibonacci resistance level of 1211 after which the path towards 1250 will get cleared.
The relative strength index is at 62 indicating a STRONG demand for Ether and the continuation of the buying pressure in the markets.
The Williams percent range is back over -50 in the daily time frame indicating a bullish sentiment.
The STOCHRSI is indicating an oversold level, which means that the prices are expected to correct upwards in the short-term range.
Most of the technical indicators are giving a STRONG BUY market signal.
Most of the moving averages are giving a BUY signal, and we are now looking at the levels of $1250 to $1300 in the short-term range.
ETH is now trading below its 100 hourly simple and exponential moving averages.
[*] Ether: bullish reversal seen above the $1075 mark
[*] The short-term range appears to be strongly bullish
[*] ETH continues to remain above the $1100 level
[*] The average true range is indicating LESS market volatility
Ether: Bullish Reversal Seen Above $1075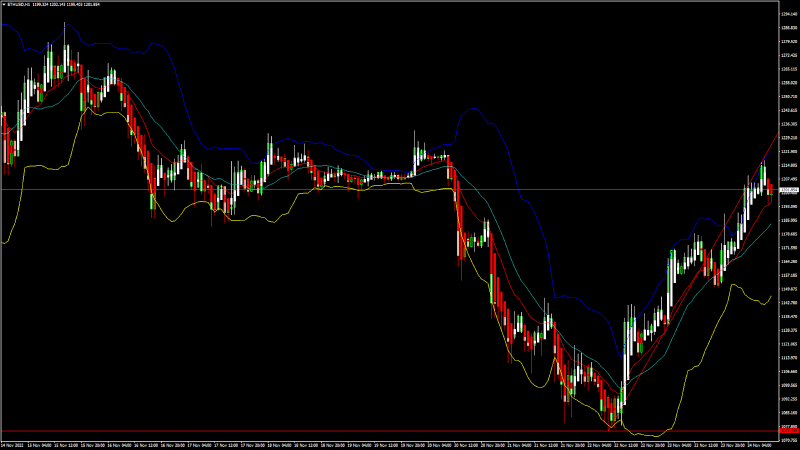
ETHUSD is now moving into a strongly bullish channel with the price trading above the $1100 handle in the European trading session today.
ETH continues to correct higher against the US dollar and is expected to stay above the $1200 level.
ETHUSD touched an intraday low of 1168 in the Asian trading session and an intraday high of 1217 in the European trading session today.
We can see the formation of both the bullish harami and bullish harami cross pattern in the 1-hour time frame.
The momentum indicator is back over zero in the 15-minute time frame.
The resistance of the channel is broken in the 1-hour time frame indicating a bullish trend.
The daily RSI is printing at 43 indicating a neutral demand for Ether in the long-term range.
The key support levels to watch are $1185 at which price crosses the 9-day moving average, and $1195 which is a 14-3 day raw stochastic at 20%.
ETH has increased by 3.00% with a price change of 35.00$ in the past 24hrs and has a trading volume of 11.226 billion USD.
We can see a decrease of 7.02% in the total trading volume in the last 24 hrs which appears to be normal.
The Week Ahead
ETH price continues to remain in a strongly bullish zone against the US dollar and bitcoin. ETHUSD is expected to correct higher towards the $1200 and $1300 levels this week.
We can see the formation of a major bullish trendline in place from $1075 towards $1234 level.
The immediate short-term outlook for Ether has turned strongly bullish, the medium-term outlook has turned neutral, and the long-term outlook for Ether is neutral in present market conditions.
The price of ETHUSD will need to remain above the important support levelsof $1144 which is a 3-10 day MACD oscillator stalls.
The weekly outlook is projected at $1250 with a consolidation zone of $1200.
Technical Indicators:
The relative strength index (14): is at 62.17 indicating a BUY
The rate of price change: is at 2.80 indicating a BUY
Bull/bear power (13): is at 8.042 indicating a BUY
High/lows (14): is at 3.72 indicating a BUY
VIEW FULL ANALYSIS VISIT - FXOpen Blog...
Disclaimer: CFDs are complex instruments and come with a high risk of losing your money.
AUD/USD and NZD/USD Could Accelerate Higher
AUD/USD is moving higher and might accelerate higher above 0.6780. NZD/USD is also rising and might aim more upsides above 0.6300.
Important Takeaways for AUD/USD and NZD/USD
[*] The Aussie Dollar started a fresh increase above the 0.6550 and 0.6640 levels against the US Dollar.
[*] There is a key bullish trend line forming with support near 0.6715 on the hourly chart of AUD/USD.
[*] NZD/USD is gaining bullish pace above the 0.6250 support zone.
[*] There is a major bullish trend line forming with support near 0.6245 on the hourly chart of NZD/USD.
AUD/USD Technical Analysis
The Aussie Dollar formed a base above the 0.6560 level and started a fresh increase against the US Dollar. The AUD/USD pair gained pace above the 0.6590 level to move into a positive zone.
There was a clear move above the 0.6640 level and the 50 hourly simple moving average. The pair even climbed above the 0.6720 level and traded as high as 0.6778. It is now correcting gains and trading below the 0.6770 level.
AUD/USD Hourly Chart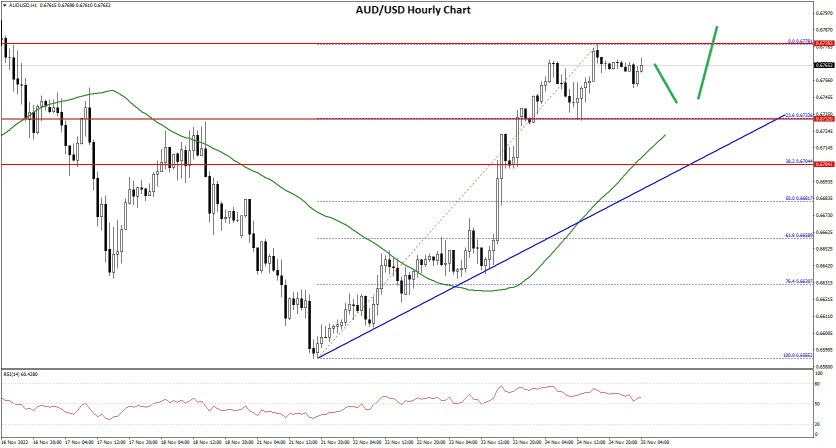
On the downside, an initial support is near the 0.6735 level. It is near the 23.6% Fib retracement level of the upward move from the 0.6585 swing low to 0.6778 high.
The next support could be the 0.6715 level. There is also a key bullish trend line forming with support near 0.6715 on the hourly chart of AUD/USD. If there is a downside break below the 0.6715 support, the pair could extend its decline towards the 0.6680 level.
It is near the 50% Fib retracement level of the upward move from the 0.6585 swing low to 0.6778 high. On the upside, the AUD/USD pair is facing resistance near the 0.6775 level.
The next major resistance is near the 0.6800 level. A close above the 0.6800 level could start a steady increase in the near term. The next major resistance could be 0.6920.
VIEW FULL ANALYSIS VISIT - FXOpen Blog...
Disclaimer: CFDs are complex instruments and come with a high risk of losing your money.
Watch FXOpen's November 21 - 25 Weekly Market Wrap Video
In this video, FXOpen UK COO Gary Thomson sums up the week’s happenings and discusses the most significant news reports.
[*] Why is gold going up?
[*] NZD at 3-month highs
[*] COVID outbreak in China, oil finds support
[*] Bitcoin hits new year low amid rumors of another high-profile bankruptcy.
Watch our short and informative video, and stay updated with FXOpen.
FXOpen YouTube
Disclaimer: CFDs are complex instruments and come with a high risk of losing your money.
GBP/USD and GBP/JPY At Risk of Downside Break
GBP/USD started a downside correction from the 1.2150 resistance. GBP/JPY is diving and there are chances of a move towards the 166.00 support.
Important Takeaways for GBP/USD and GBP/JPY
[*] There is a key bullish trend line forming with support near 1.2040 on the hourly chart of GBP/USD.
[*] GBP/JPY started a fresh decline from the 169.00 resistance zone.
[*] There was a break below a major bullish trend line with support near 167.85 on the hourly chart.
GBP/USD Technical Analysis
This past week, the British Pound found support near the 1.1800 zone against the US Dollar. The GBP/USD pair formed a base and started a steady recovery wave above the 1.2000 level.
There was a clear move above the 1.2050 resistance and the 50 hourly simple moving average. However, the pair struggled to clear the 1.2150 resistance zone. A high was formed near 1.2153 on FXOpen and the pair started a downside correction.
GBP/USD Hourly Chart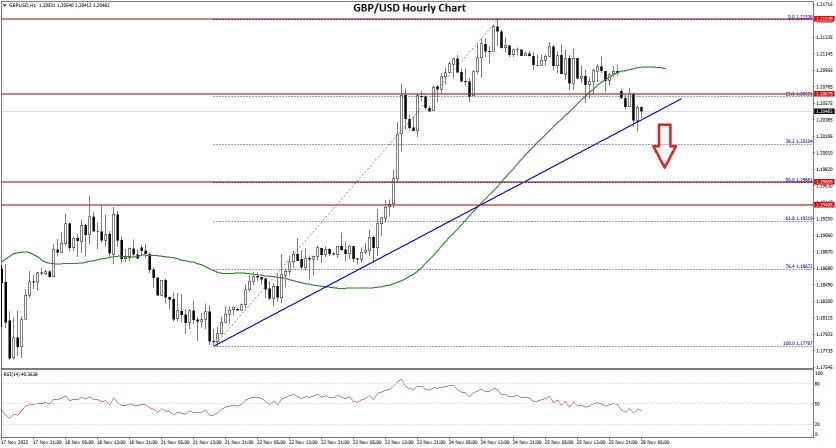
There was a move below the 1.2100 support and the 50 hourly simple moving average. The pair declined below the 23.6% Fib retracement level of the main increase from the 1.1778 swing low to 1.2153 high.
An immediate support is near the 1.2040. There is also a key bullish trend line forming with support near 1.2040 on the hourly chart of GBP/USD.
The next major support is near the 1.2000 level. If there is a break below the 1.2000 support, the pair could test the 1.1965 support or the 50% Fib retracement level of the main increase from the 1.1778 swing low to 1.2153 high. Any more losses might send GBP/USD towards 1.1880.
An immediate resistance on the upside is near the 1.2075 level. The next major resistance is near the 1.2120 level, above which the pair could start a steady increase towards 1.2150.
An upside break above 1.2150 might start a fresh increase towards 1.2250. Any more gains might call for a move towards 1.2320 or even 1.2400.
VIEW FULL ANALYSIS VISIT - FXOpen Blog...
Disclaimer: CFDs are complex instruments and come with a high risk of losing your money.
GBP rises to 1.21 against USD in bizarre twist
A reduction in inflation is a good thing, is it not?
Surely when a national economy previously blighted by what appeared to be runaway inflation suddenly gets back on track and the inflation figure falls dramatically, this would be the sign of strengthening and therefore have a positive effect on the national sovereign currency?
In the case of the United States economy and the United States Dollar, quite the opposite appears to be the case.
The US Dollar has spent the majority of this year demonstrating remarkable strength against a floundering British Pound and almost equally floundering Euro, despite all of North America, Britain and mainland Europe being subject to similar levels of surging inflation.
The US Dollar held firmer because of the greater productivity which took place in the US economy during the past 2 years compared to all-encompassing lockdowns in Europe and the United Kingdom = by contrast only parts of the United States were subject to lockdowns - and the United States' overall return to productivity soon after that charade finished.
However, in terms of inflation levels, both continents on each side of the Atlantic had experienced almost double-digit inflation which was then countered by central bank intervention in the form of several interest rate rises.
Just last week, however, the United States inflation figure was recorded as having dropped to 7.7% whereas the United Kingdom's is now around 11% and rising, with potential interest rate figures of a projected 5% looking likely by early 2023.
Despite this, however, the US Dollar has actually declined in value compared to the British Pound, and the Pound is now making some headway after a long period of depreciation. This morning, the GBPUSD pair is trading at 1.21, which is a substantial increase over the 1.18 of last week.
One theory is that investors may be looking at some early indications that US inflation may finally be easing, potentially paving the way for the Federal Reserve (US central bank) to reduce the speed at which it has been boosting borrowing costs, therefore indicating that consumers may start borrowing again and in a period of economic difficulty, that would add to the nation's overall liabilities.
Conversely, many mortgage lenders in the United Kingdom have removed products from their range, making it much harder for people to get mortgages as the potential increase in interest rates which is predicted for next year is outside the risk management scope of retail mortgage lenders.
In short - they are worried that borrowers may not be able to afford the payments if the interest rate rises sharply.
Overall, keeping borrowing down is a prudent policy during times of economic difficulties.
Perhaps that is why the Pound suddenly struck back against the US Dollar. One thing's for sure, it is not because of any sudden prowess in the British money market; that is still in the doldrums and blighted by cost of living crises and high inflation.
VIEW FULL ANALYSIS VISIT - FXOpen Blog...
Disclaimer: This forecast represents FXOpen Companies opinion only, it should not be construed as an offer, invitation or recommendation in respect to FXOpen Companies products and services or as financial advice.
Crypto lender's demise sends fears into digital markets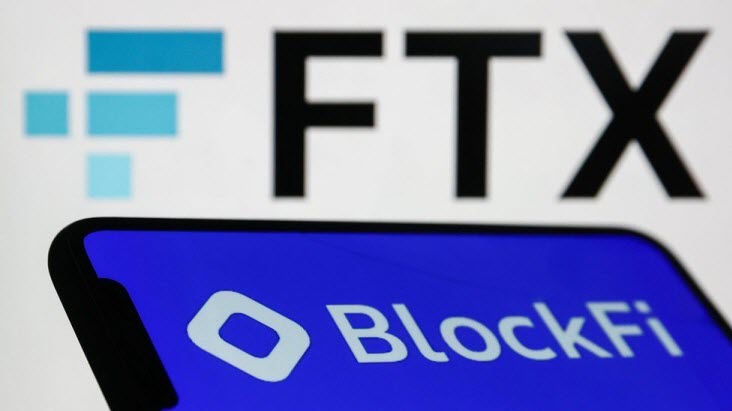
The unsurprising fall out from the catastrophic and high profile demise of cryptocurrency exchange FTX has begun to make its presence felt.
At the end of the working day in the United States, it became publicly known that BlockFi, a commercial lending company which was founded in 2017 to provide credit services to markets with limited access to simple financial products, had gone bankrupt.
At one point in its five-year lifespan, BlockFi was valued at an astronomical $3 billion, however, like so many components of the modern economy, BlockFi has gone from startup to billion-dollar hyperbole, to ashes in just 5 years.
BlockFi announced earlier this month that it had halted withdrawals, citing “significant exposure” to the FTX exchange in the immediate aftermath of its demise. What that really means is that BlockFi had borrowed money from FTX, and when FTX went to the wall, BlockFi's assets became the interest of receivers.
This has represented yet another dark day for the digital asset sector, and this time has highlighted how it is not just cryptocurrency exchanges with unscrupulous owners that can collapse like a house of cards, but also others offering bona fide financial services such as lending, which can have their lives claimed because the board of directors put its faith in individuals such as Sam Bankman-Fried.
The result of this news is that Bitcoin had dipped in value once again over night, but interestingly it is now rising in value as the European markets opened this morning.
Bitcoin now stands at just a touch over $16,450, but certainly there has been some volatile movement this morning due to the 'sailing close to the wind' nature that BlockFi has demonstrated.
It may well be easy to blame BlockFi's demise on its dealings with FTX, but actually BlockFi had already shown signs of financial strife before Mr Bankman-Fried headed for the hills with his customers' money.
Back in the summer of this year, BlockFi ran into financial trouble and managed to secure a $250 million emergency funding from FTX.
Because BlockFi owed FTX this sum, the receivers moved in on BlockFi when FTX went bankrupt. At that time, Mark Renzi of Berkley Research Group stated in a corporate announcement “With the collapse of FTX, the BlockFi management team and board of directors immediately took action to protect clients and the Company.”
BlockFi revealed in its Chapter 11 petition that its three largest creditor claims are a $729 million indenture from Ankura Trust, a distressed loan administration company, a $275 million loan from West Realm Shires, the holding company for FTX’s US subsidiary, as well as a $30 million settlement payment to the U.S. Securities and Exchange Commission.
Big debts and a big bankruptcy. The question remains, is it a buyers market right now, or are the bears still out in force?
VIEW FULL ANALYSIS VISIT - FXOpen Blog...
Disclaimer: This forecast represents FXOpen Companies opinion only, it should not be construed as an offer, invitation or recommendation in respect to FXOpen Companies products and services or as financial advice.
BTCUSD and XRPUSD Technical Analysis – 29th NOV 2022
BTCUSD: Bullish Engulfing Pattern Above $15510
Bitcoin was unable to sustain its bearish momentum and after touching a low of 15510 on 21st Nov, the price started to correct upwards against the US dollar crossing the $16500 handle today in the European trading session.
The price of bitcoin continues to rise after the recent crash and now we are looking to cross the $17000 handle soon.
We can see the formation of bullish engulfing lines in the daily time frame.
The CCI indicator is giving a bullish divergence signal in the daily time frame.
We can clearly see a bullish engulfing pattern above the $15510 handle which is a bullish reversal pattern because it signifies the end of a downtrend and a shift towards an uptrend.
Bitcoin touched an intraday low of 16124 in the Asian trading session and an intraday high of 16536 in the European trading session today.
Both the STOCH and STOCHRSI are indicating overbought levels which means that in the immediate short term, a decline in the prices is expected.
The relative strength index is at 63 indicating a STRONG demand for bitcoin, and the continuation of the buying pressure in the markets.
Bitcoin is now moving above its 100 hourly simple moving average and 200 hourly exponential moving average.
Most of the major technical indicators are giving a STRONG BUY signal, which means that in the immediate short term, we are expecting targets of 17000 and 17500.
The average true range is indicating LESS market volatility with a strong bullish momentum.
[*] Bitcoin: a bullish reversal seen above $15510
[*] The Williams percent range is indicating an overbought level
[*] The price is now trading above its pivot level of $16509
[*] All of the moving averages are giving a STRONG BUY market signal
Bitcoin: Bullish Reversal Seen Above $15510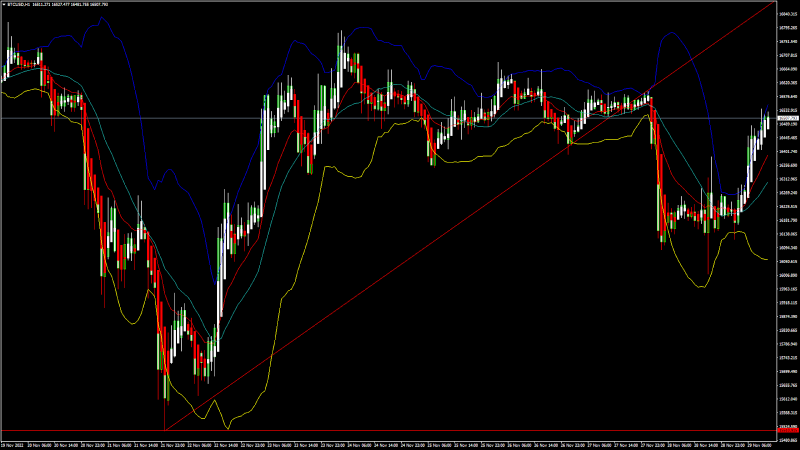
We can now see that the price of Bitcoin is moving in a strong bullish momentum and we are expecting more upside waves this week.
The Williams percent range indicator is back over -50 indicating a bullish scenario in the daily time frame.
The MACD has crossed UP its moving average in the 4-hour time frame indicating bullish trends.
We can see the formation of a bullish price crossover pattern with an adaptive moving average AMA100 in the 4-hour time frame.
The price of bitcoin is ranging near the support of the channel in the 15-minute time frame indicating a bullish trend.
The immediate short-term outlook for bitcoin is strongly bullish, the medium-term outlook has turned bullish, and the long-term outlook remains neutral under present market conditions.
Bitcoin’s support zone is located at $16155 which is a 14-3 day raw stochastic at 20%.
The price of BTCUSD is now facing its classic resistance level of 16536 and Fibonacci resistance level of 16550 after which the path towards 17000 will get cleared.
In the last 24hrs, BTCUSD has increased by 1.92% by 310$, and has a 24hr trading volume of USD 26.099 billion. We can see an increase of 3.95% in the trading volume compared to yesterday, which appears to be normal.
The Week Ahead
The price of Bitcoin is expected to enter the super bullish zone above the $17000 handle. There is an ascending channel forming with current support at $15510 on the hourly chart of BTCUSD.
We can see that the MACD indicator is back over zero in the 2-hour time frame indicating the bullish scenario present in the markets.
The daily RSI is printing at 41 which indicates a weaker demand for bitcoin and the possibility of a shift towards the consolidation/correction phase for a short term in the markets.
The price of BTCUSD is now facing its resistance zone at $17113 which is a 14-3 day raw stochastic at 50%.
The weekly outlook is projected at $17500 with a consolidation zone of $17000.
Technical Indicators:
The moving averages convergence divergence, MACD (12,26): is at 48.30 indicating a BUY
The commodity channel index, CCI (14): is at 93.27 indicating a BUY
The rate of price change, ROC: is at 1.537 indicating a BUY
The bull/bear power (13): is at 217.36 indicating a BUY
VIEW FULL ANALYSIS VISIT - FXOpen Blog...
Disclaimer: This forecast represents FXOpen Companies opinion only, it should not be construed as an offer, invitation or recommendation in respect to FXOpen Companies products and services or as financial advice.
EUR/USD Correct Gains While EUR/JPY Faces Key Hurdle
EUR/USD is gaining pace above the 1.0000 resistance. EUR/JPY is also rising and might climb further higher above the 147.00 zone.
Important Takeaways for EUR/USD and EUR/JPY
[*] The Euro started a downside correction from the 1.0500 resistance zone.
[*] There is a key declining channel forming with support near 1.0310 on the hourly chart.
[*] EUR/JPY started a strong decline and settled below the 144.50 support zone.
[*] There is a major bearish trend line forming with resistance near 144.15 on the hourly chart.
EUR/USD Technical Analysis
The Euro formed a base above the 1.0200 zone and started recovery wave against the US Dollar. The EUR/USD pair was able to clear the 1.0320 and 1.0400 resistance levels.
There was a clear move above the 1.0420 level and the 50 hourly simple moving average. The pair even climbed above 1.0450 and traded as high as 1.0496. It is now correcting gains below the 1.0450 level.
EUR/USD Hourly Chart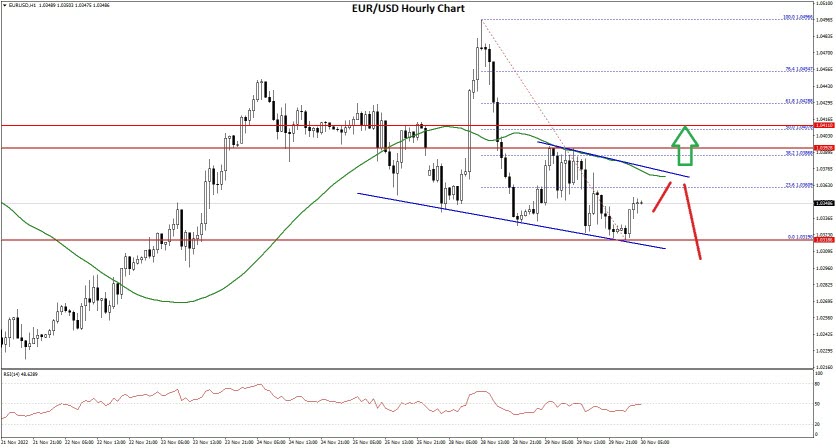
There was a drop below the 1.0350 level and the pair traded as low as 1.0319. On the downside, the pair might find support near the 1.0320 level. Besides, there is a key declining channel forming with support near 1.0310 on the hourly chart.
The next major support sits near the 1.0265 level, below which the pair could even test the 1.0220 support zone. If there is a downside break below the 1.0220 support, the pair might accelerate lower in the coming sessions. In the stated case, it could even test 1.0150.
On the upside, an immediate resistance is near the 1.0375 level. The next major resistance is near the 1.0400 level or the 50% Fib retracement level of the downward move from the 1.0496 swing high to 1.0319 low. The main resistance is near the 1.0450 level.
A clear move above the 1.0450 resistance might send the price towards 1.0500. If the bulls remain in action, the pair could visit the 1.0550 resistance zone in the near term.
VIEW FULL ANALYSIS VISIT - FXOpen Blog...
Disclaimer: This forecast represents FXOpen Companies opinion only, it should not be construed as an offer, invitation or recommendation in respect to FXOpen Companies products and services or as financial advice.
Bitcoin responds positively as Brazil welcomes crypto payments
Within Latin America, Brazil has for many years been a burgeoning economic force.
It is a large nation with a diversified economy, ranging from manufacturing and engineering to banking and tertiary services and is part of the all-important BRICS (Brazil, India, China, South Africa) economic bloc.
Like all other nations in South America, Brazil is a developing economy, but it has been rapidly developing and is far ahead of all of the other national economies in the continent.
Today, Brazil's government has taken a very prominent step forward in announcing that the country's lawmakers have approved a bill which regulates Bitcoin and other cryptocurrencies as a payment instrument.
Investors appear to have responded well to the news, as Bitcoin began to pump almost immediately, followed by a short squeeze and then it pumped again.
Bitcoin is currently trading at $16,876.80, which is a 2.68% increase over yesterday's value. That may not sound very much on the face of it, but Bitcoin values have been very stagnant recently, so a 2.68% increase when viewed on the chart is quite significant.
Private individuals and businesses have a lot to gain from the new ruling which allows cryptocurrency to be used as a method of payment, because South American economies for many decades now have been synonymous with rampant inflation, draconian capital control laws causing people to lose their money when it depreciates, and in many countries in South America, a deep-seated distrust in the local banking infrastruture or government policy.
Around 10 years ago, neighboring Argentina ordered the liquidation of US Dollar bank accounts held in North America by Argentinian citizens, and that the US Dollars should be repatriated to Argentina and converted to Pesos. At the same time, capital controls were invoked so that nobody could transfer their Pesos out of the country without government permission.
This meant that anyone who adhered to that rule would be at grave risk of substantial loss due to a terrible conversion rate and then having to store Pesos which are notorious for depreciating at the rate of an iron girder falling off a cliff.
At that time, Bitcoin was in its absolute infancy, and still very much an unknown quantity. It had a tiny following of enthusiasts and 1 Bitcoin was worth something like $50, however a core group of Argentinian enthusiasts began to rally the cause of Bitcoin, largely because they saw it as an independent method of conducting their everyday life without the restrictions and inflationary chaos associated with Peso.
Now, many years later, Bitcoin and many other cryptocurrencies are very established globally, and South America's largest economy is opening its doors to them.
If this paves the way for greater acceptance across the South American continent, it could well be a boon for citizens as well as for the cryptocurrency market itself.
VIEW FULL ANALYSIS VISIT - FXOpen Blog...
Disclaimer: This forecast represents FXOpen Companies opinion only, it should not be construed as an offer, invitation or recommendation in respect to FXOpen Companies products and services or as financial advice.